
Multifamily operators collect information across leasing, accounting, maintenance, resident services, and revenue management. Turning those records into useful analysis requires consistent definitions, reliable connections between systems, and a clear understanding of the questions teams need to answer.
The National Apartment Association’s discussion of business intelligence identifies stale records, duplicate data, and disconnected systems as obstacles to useful analysis. It emphasizes integration and standardized processes as practical foundations for information that teams can trust and use.
Multifamily business intelligence brings that information together to help teams understand results, investigate changes, and evaluate decisions at the property and portfolio level. Historical reports establish what happened, current operational data helps explain conditions, and forward-looking analysis supports planning.
For lean teams, the value is practical: less time reconciling reports and more time understanding which properties need attention and why. This article explains how multifamily BI works, with a focus on using leasing and revenue performance data to support asset strategy.
Related:
- Best Tools for Multifamily Property Managers: 7 Categories to Evaluate
- What is a Good Cap Rate for Multifamily Properties?
What Is Multifamily Business Intelligence?
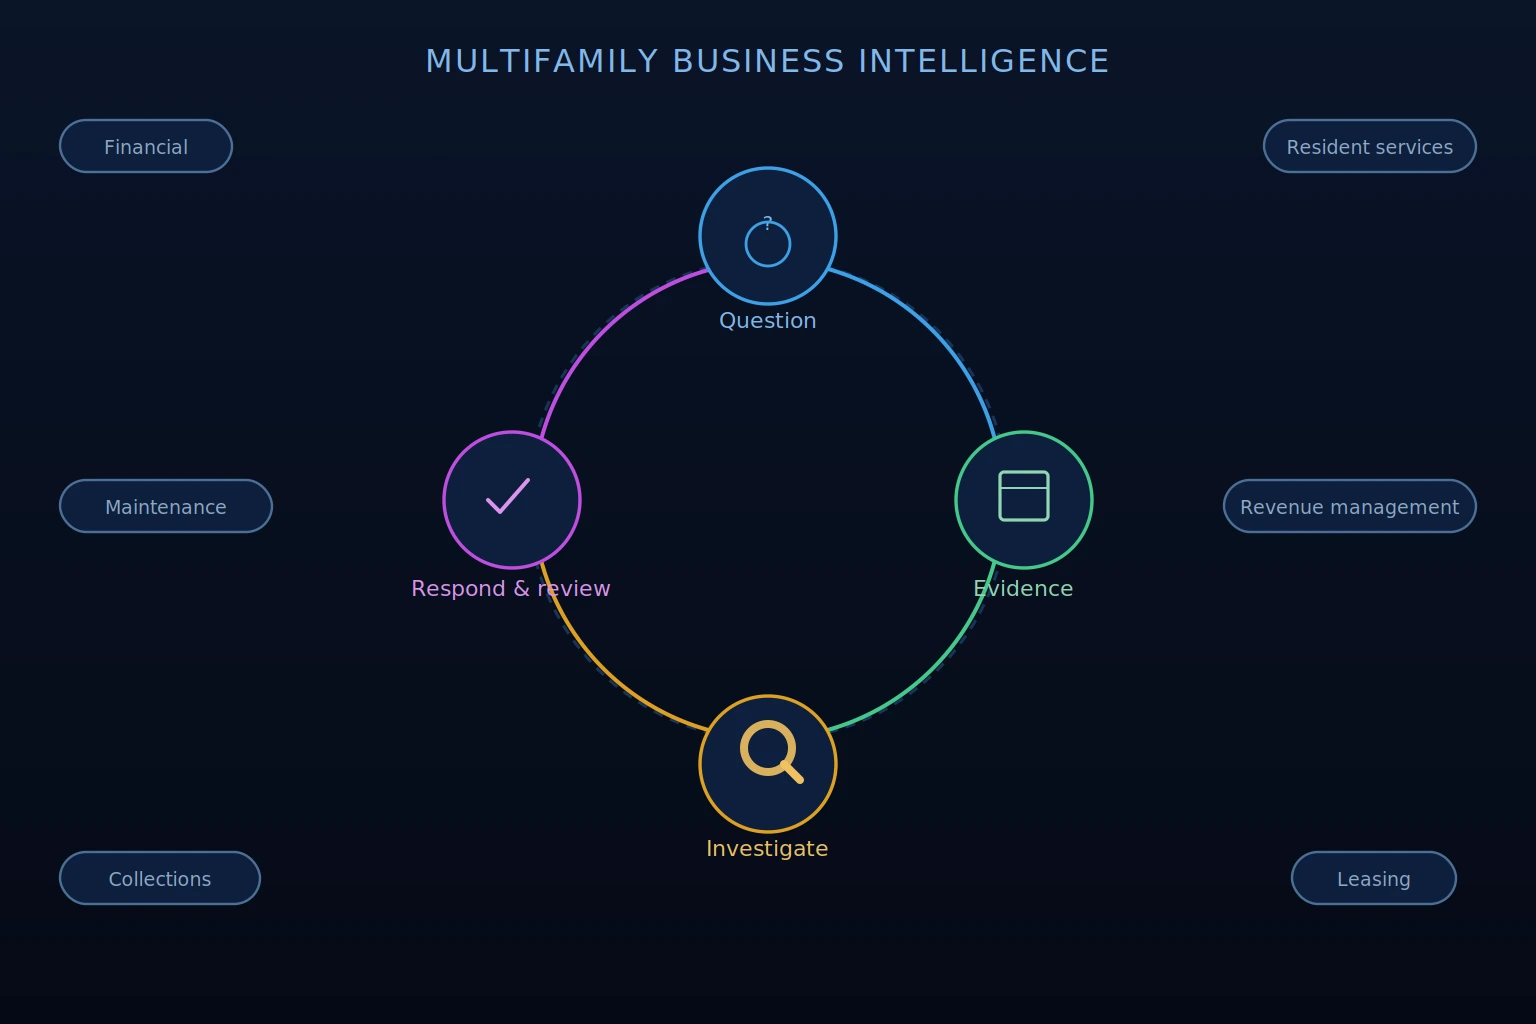
Multifamily business intelligence is the combination of data, systems, processes, and analysis that helps operators evaluate property and portfolio performance. It includes recurring reports, dashboards, detailed investigation, and forward-looking views where the available data and methods support them.
Its scope can extend across financial performance, collections, maintenance, resident services, leasing, and revenue management. Different teams use that information for different questions: an operations manager may investigate recurring service delays, while a revenue manager reviews whether leasing pace is keeping up with upcoming availability.
The National Apartment Association emphasizes consistent data definitions and reporting tied to property goals. Those foundations help teams interpret results consistently and focus their analysis on the decisions they need to make.
Strong BI connects a question with supporting evidence and a review process. Teams can identify a change, investigate contributing factors, evaluate a response, and revisit the results using a shared understanding of the data.
How Reporting and Analysis Work Together
Reporting is a core part of business intelligence. Consistent reports establish what happened over a defined period, help teams track progress against goals, and provide a shared basis for operational and ownership reviews.
Analysis builds on that foundation by investigating the factors behind a result. A monthly occupancy report may show a decline. Reviewing move-ins, departures, leasing conversion, and unit readiness can help teams understand what contributed to it and which areas warrant attention.
Forward-looking analysis adds planning context. Scheduled expirations, renewal status, signed leases awaiting move-in, and anticipated availability informed by historical performance help teams assess how conditions may develop. These views depend on the quality of the underlying records and assumptions, so they should be reviewed alongside current and historical results.
The value comes from moving between these views without repeatedly rebuilding the information. Teams need to see the result, investigate the relevant details, and evaluate what it means for the property’s strategy. Reports, dashboards, and analytical tools each support part of that process.
Build a Reliable Data Foundation
Useful multifamily BI starts with understanding where information comes from, how it is updated, and what each measure represents. Connecting systems helps teams bring records together, but consistent definitions and review processes are what make the resulting comparisons meaningful.
Identify the relevant sources. The PMS typically provides lease, resident, occupancy, and availability records. Leasing CRM systems contribute prospect activity and funnel data. Accounting systems provide financial results and collections information, while maintenance platforms contribute work order, cost, and unit-readiness records. The exact mix depends on the operator’s systems and integrations.
Distinguish records from calculated measures. Lease dates, rent charges, notices, and prospect interactions are underlying records. Effective rent, conversion rates, lease trade-out, and forward-looking estimates are calculated from those records using defined methods. Teams need to understand those methods before comparing results across properties or periods.
Use consistent definitions and timeframes. Establish how measures are calculated, which records are included, and when reporting periods begin and end. For renewal analysis, for example, keep signed renewals, confirmed departures, and pending decisions distinct so an incomplete expiration period is not compared directly with a completed one.
Check freshness and completeness. Confirm how frequently integrations update and how missing or conflicting records are identified. Outdated availability, incomplete concession details, or inconsistent layout assignments can change the interpretation of performance.
A reliable foundation gives teams confidence in the questions they can answer while making limitations visible. When a result looks unexpected, they should be able to investigate the supporting records and assumptions before acting.
Connect Portfolio Priorities With Property-Level Analysis
Multifamily BI needs to function at both the portfolio and property levels, with each supporting different questions.
Portfolio-level BI helps teams prioritize. Which properties are drifting from targets? Where are multiple conditions shifting together? How does each asset compare with its own historical performance? Comparisons across properties should use consistent definitions and periods while accounting for differences such as lease-up stage, renovation activity, and unit mix.
Property-level BI helps teams investigate those findings. Which layouts are contributing to a leasing velocity gap? Where in the funnel is conversion changing? How do renewal outcomes and upcoming availability affect the expiration windows that need attention? This detail helps teams evaluate the operational response.
The ability to move from a portfolio-wide signal to a property, layout, and supporting records is a practical strength of BI. When that investigation can happen within connected views, teams spend less time assembling separate reports and more time understanding what the findings mean for each asset’s strategy.
Read Also:
Five Areas for Leasing and Revenue Analysis
Occupancy
Evaluate occupancy by layout and property against asset-specific targets and prior-period performance. Property-level averages provide a starting point, while layout-level analysis reveals differences within the asset. Review occupancy alongside signed leases awaiting move-in, confirmed departures, and upcoming availability to understand both current results and potential pressure.
Leasing
Leasing analysis connects lead volume, funnel conversion, leasing velocity, and days on market with available inventory and occupancy goals. Reviewing these measures together helps teams investigate whether a slowdown reflects weaker demand, conversion challenges, unit readiness, or pricing. Use consistent periods and account for the number of units available when interpreting changes.
Renewals
Renewal analysis connects signed renewals, confirmed departures, and pending decisions by layout and expiration window. Review renewal trade-out, outreach and follow-up status, and reasons for non-renewal alongside forward exposure. These measures help teams assess retention outcomes and identify where further investigation or resident engagement may be useful.
Exposure
Exposure analysis shows scheduled lease expirations against configured targets by layout and time window. Known upcoming availability and additional anticipated availability, such as month-to-month behavior and early terminations informed by historical performance, provide further planning context. Keep estimates distinct from confirmed departures and reconcile overlapping records to avoid counting the same unit twice.
Revenue Performance
Revenue analysis includes effective rent, concession usage, value and prevalence, new lease and renewal trade-out, loss to lease, and in-place rent and scheduled rental revenue trends. Together, these measures help teams understand how individual lease decisions accumulate across the rent roll. Review them alongside occupancy and financial results, recognizing that scheduled revenue and effective rent are different from cash collected.
How AI Supports Multifamily Business Intelligence
AI can support multifamily BI by identifying patterns across connected data, summarizing changes, and helping teams investigate performance questions. Across several properties, that assistance can reduce the time needed to review related signals and decide where closer attention is warranted.
AI-generated Insights can highlight changes in leasing, renewals, exposure, and revenue performance, explain why they may matter, and suggest areas for further review. Their value comes from connecting the findings with the asset’s operational context.
Conversational AI analysis gives teams another way to explore the data. They can ask questions, examine contributing factors, and follow up on a result without assembling a separate report for every step. Useful answers provide supporting information, explain the reasoning, and make relevant assumptions or limitations clear.
At the 2026 Apartmentalize conference, speakers emphasized that useful AI analysis depends on reliable data, consistent processes, and people who can validate and interpret the results. The National Apartment Association’s session recap reinforces the importance of pairing analytical tools with clear business goals and human oversight.
AI-assisted analysis remains distinct from the purpose-built pricing algorithms that generate Rentana’s pricing recommendations. Teams should evaluate analytical findings and recommendations against property conditions and asset strategy, with human judgment guiding the response.
How Rentana Supports Multifamily Business Intelligence
Rentana is a revenue intelligence platform that supports the BI needs of property teams, revenue managers, and asset managers focused on pricing, leasing, renewals, exposure, and revenue performance. It connects PMS-sourced operational data with reporting, forward-looking visibility, and tools for investigating performance.
Dashboards, charts, and reports give teams a shared view of property and portfolio results. Configurable timeframes and layout filters help teams move from an overview into the details contributing to a change.
Metrics Browser supports analysis across layouts, custom unit groups, property groups, and time periods, helping teams investigate questions beyond their recurring reports.
Predicted Occupancy and exposure analysis add forward-looking context. Teams can review occupancy expectations, scheduled expirations against configured targets, known upcoming availability, and additional anticipated availability informed by historical performance.
Purpose-built pricing recommendations by layout draw on property-level performance signals, forward availability, and configured asset strategy. Supporting inputs and reasoning help teams evaluate recommendations alongside their broader performance analysis.
AI-generated Insights highlight operational changes and explain why they may warrant closer attention.
Ask Rentana, the AI analyst, lets teams investigate questions about absorption, retention, concessions, conversion, and property performance. Explained reasoning, interactive charts and tables, and downloadable analysis support follow-up questions, team discussions, and ownership communication.
These capabilities support the revenue-focused part of a broader BI workflow, helping teams connect performance findings with asset strategy and the decisions they need to evaluate.
Conclusion on Multifamily Business Intelligence
Multifamily business intelligence is most useful when it connects reliable data with the questions teams need to answer. Consistent reporting establishes results, detailed analysis helps explain changes, and forward-looking views provide context for planning.
Moving between portfolio priorities and property-level detail helps teams identify where attention is needed and evaluate responses against each asset’s strategy. AI-assisted analysis can support that investigation, while teams remain responsible for interpreting findings and deciding what to do.
The value of BI is in how teams use it: to understand performance, coordinate action, and review whether their decisions are supporting occupancy and revenue goals.