Managing a multifamily portfolio means making decisions across multiple assets simultaneously, often with data spread across different systems, different reporting formats, and different levels of currency. The picture that emerges from that process is frequently incomplete, sometimes stale, and rarely organized around the questions that actually need to be answered.
Performance analytics software for multifamily portfolios exists to close that gap. The right platform connects operational data from across the portfolio into a view that supports prioritization, comparison, and forward-looking decisions rather than just historical reporting.
This article covers what portfolio performance analytics means in a multifamily context, what data matters most, what to look for when evaluating platforms, and how Rentana supports the internal operational analysis that asset managers and revenue managers need.
Related:
What Is Multifamily Portfolio Performance Analytics?
Multifamily portfolio performance analytics is the practice of aggregating and analyzing operational data across multiple properties to understand how assets are performing individually and relative to each other, identify where conditions are changing, and support decisions about pricing, leasing, renewals, and exposure management.
The goal is not to produce more reports. It is to surface the right information at the right level of detail to support faster, better-informed decisions across a portfolio where not every asset needs equal attention at the same time.
Why Property-Level Reporting Alone Is Not Enough
When every asset is reviewed individually on a fixed schedule, the process is sequential and the picture is always partially stale. An asset manager with twelve properties reviewing each one separately may catch problems, but only after spending significant time assembling the picture for each property before any comparison or prioritization is possible.
According to Multifamily Dive's 2026 multifamily outlook, true operational transformation in 2026 will hinge on the centralization of technology and operations across the portfolio, with operators who unify data across systems gaining clearer visibility into revenue performance, operational inefficiencies, and new opportunities, giving leadership the strategic foresight needed for long-term portfolio growth.
Portfolio performance analytics changes the starting point. Rather than reviewing each property and then trying to identify which ones need attention, the analysis surfaces where multiple conditions are shifting simultaneously and which assets warrant closer focus. That shift from sequential review to parallel visibility is what makes portfolio-scale analysis operationally different from property-level reporting.
Core Metrics Portfolio Multifamily Teams Need Visibility Into
The metrics worth prioritizing are the ones connected directly to revenue and occupancy outcomes, evaluated at the layout and custom unit group level rather than only at the property level
- Occupancy and availability: Physical occupancy by layout alongside what is available or coming available, including noticed units and units on month-to-month leases
- Leasing velocity: How quickly available units are absorbing relative to targets and forward availability, tracked at the layout level to surface differences within the same property
- Funnel conversion: Where prospects are advancing and where they are dropping off, from inquiry through signed lease, by stage and by property
- Executed leases: The rents and lease terms being signed, including the impact of concessions, providing a clearer view of achieved pricing rather than asking rent
- Renewals: Conversion rates by layout and expiration window, trade-out between expiring and renewed lease rates, and outreach timing relative to expiration
- Exposure: The forward distribution of scheduled lease expirations and upcoming availability, with additional anticipated availability such as month-to-month behavior or early terminations incorporated based on historical performance
- Concessions: Usage, value, and prevalence by layout and property, and the impact of concession spend on effective rent over time
- Loss to lease: The difference between current market rent and the rent being charged on occupied units, and where that gap is greatest across the portfolio
Read Also:
- How To Do A Rental Market Analysis Like a Pro (With AI Tools)
- AI Tool for Public Rental Market Analysis by Zip Code
Property, Layout, and Portfolio-Level Analysis
Effective portfolio performance analytics operates at three levels simultaneously, and the decisions supported at each level are different.
At the portfolio level, the primary value is prioritization. Which assets are drifting from performance targets. Where multiple conditions are shifting simultaneously. Which properties need focused attention this week and which are stable. Portfolio-level analysis answers those questions without requiring a full review of every asset to find the answer.
At the property level, the analysis shifts to understanding what is driving the signals surfaced at the portfolio level. Where within the property is leasing velocity lagging. Which expiration windows carry the most exposure risk. How renewal conversion is trending across specific layouts.
At the layout level, the analysis is most granular and most actionable. A property running at 94% occupancy overall can have a specific two-bedroom configuration absorbing 25 days slower than the rest of the property. That signal is invisible at the property level and visible at the layout level. The decision it points toward, a pricing review, a funnel conversion check, a marketing adjustment, is specific and targeted rather than a broad response to an aggregate number.
What Asset Managers Should Look for in Analytics Software
Not all multifamily analytics platforms deliver what portfolio-scale decision-making actually requires. These criteria help evaluate whether a platform will support the work rather than add to it.
PMS-connected data. A platform that requires manual data exports or periodic uploads is working from information that is always partially stale. Direct PMS integration keeps the operational picture current without manual assembly, which is the baseline requirement for analytics that support timely decisions.
Portfolio comparison. The ability to compare performance across properties side by side, using consistent metrics and methodology, is what makes portfolio-level prioritization possible. A platform that only supports property-by-property review does not enable the cross-portfolio analysis that asset managers at scale need.
Flexible time periods and views. Operational questions change depending on the planning horizon. A platform that supports daily, weekly, monthly, and custom time period views gives teams the flexibility to answer the question they are actually asking rather than the question the platform was built to answer.
Forward-looking visibility. Historical reporting describes what happened. The most operationally useful analytics platforms surface where conditions appear to be heading, connecting current leasing activity, renewal trends, and forward availability into a view that supports decisions while there is still time to change outcomes.
Actionable insights rather than static reporting. A dashboard that presents data without context or direction adds to what teams need to review rather than reducing it. The platforms that create the most operational value surface what is changing, explain why it may matter, and point toward where attention is needed, rather than leaving interpretation entirely to the user.
How AI Can Help Surface Performance Changes
AI adds value in portfolio performance analytics primarily through pattern recognition and signal connection at a scale and speed that manual review cannot match.
Across a portfolio of ten or fifteen assets, monitoring leasing velocity, renewal conversion, exposure concentration, and pricing alignment simultaneously for every property and every unit type would require more consistent analytical attention than most teams can sustain. AI that analyzes these signals together and surfaces where multiple conditions are shifting, rather than presenting every metric with equal weight, changes what the team spends its analytical time on.
According to Multi-Housing News, AI-powered tools handle resident screening, lease renewals, and inquiries with precision, allowing leasing agents to focus on complex tasks, while predictive analytics help property managers understand occupancy patterns and enable proactive strategies to maintain high occupancy rates. The analytical value comes from pattern recognition across connected signals, not from any single metric reviewed in isolation.
Related:
How Rentana Supports Portfolio Performance Analysis for Multifamily
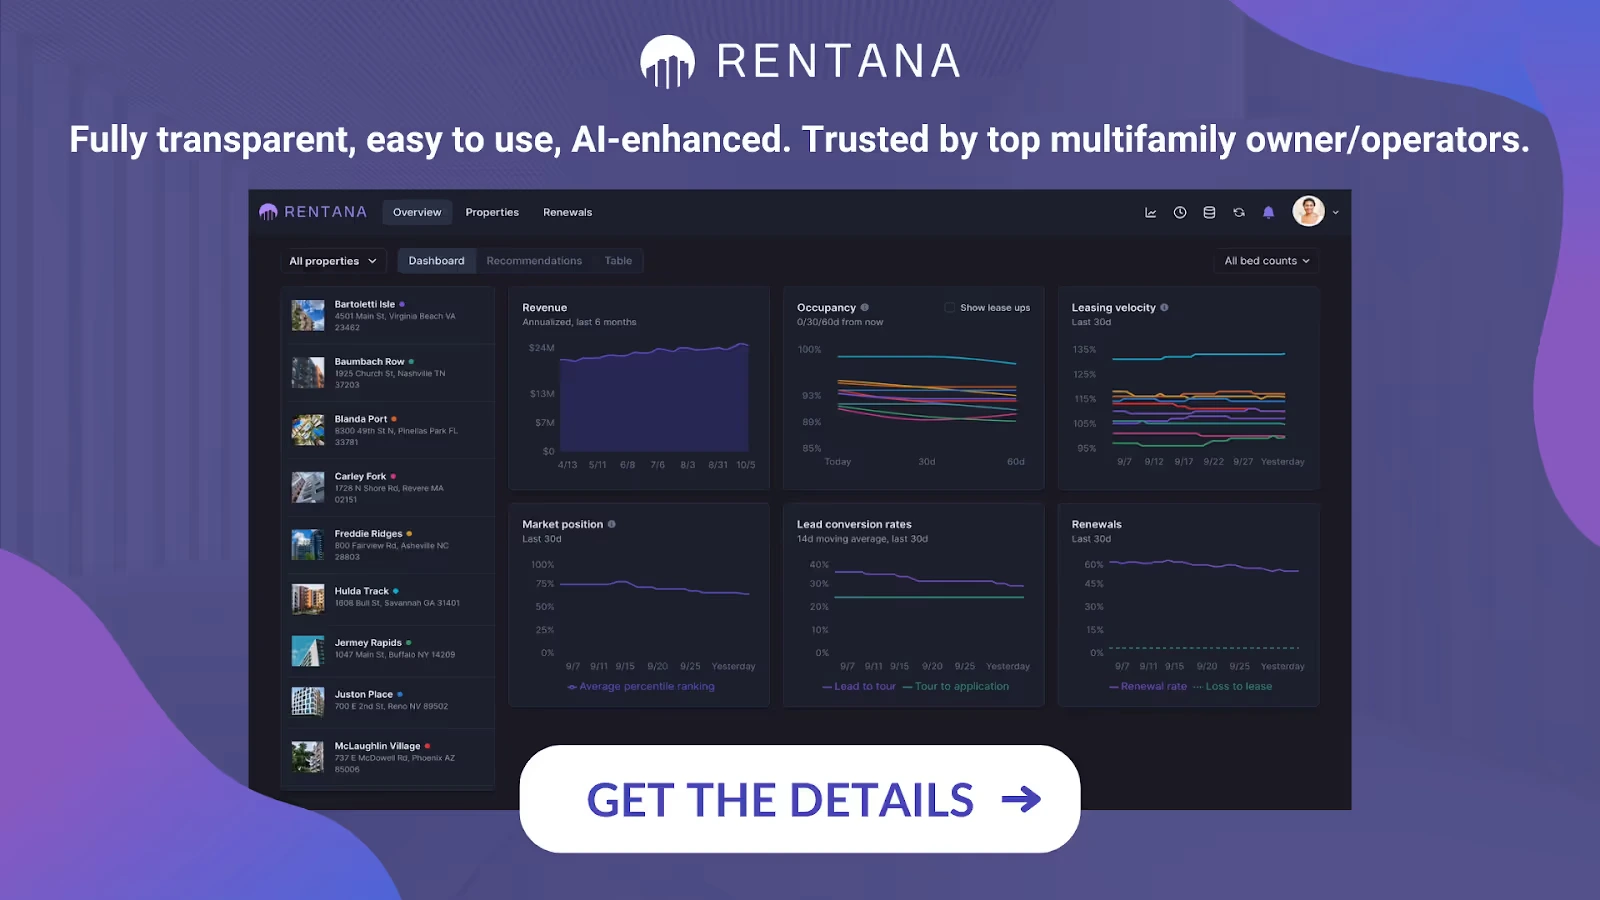
Rentana connects the analytical requirements described in this article into a single platform, with PMS-connected data, portfolio-level visibility, and forward-looking signals that support the decisions asset managers and revenue managers are actually making.
Overview dashboards give teams a color-coded, portfolio-wide view of asset health that surfaces which properties need attention without requiring sequential manual review. The movement from portfolio signal to property detail to layout-level specifics happens within the same platform.
Metrics Browser enables granular cross-portfolio analysis across more than 175 metrics by, unit type, layout, property, and time period, so specific performance questions can be investigated without building a custom report from scratch each time.
Reports consolidate operational data into structured formats that support ownership communication and asset-level performance reviews without manual assembly from separate systems.
Predicted occupancy connects current leasing activity, renewal trends, and future availability to provide forward visibility into where occupancy is heading at each asset, so teams are working from where performance is going rather than where it currently stands.
AI-generated Insights surface what is changing at specific assets, explain why it may matter given current operational conditions, and connect to a supported next step, so the analytical work of identifying where to focus is done before the team opens the platform.
Conclusion on Portfolio performance Analytics for Multifamily
Portfolio performance analytics for multifamily is about changing the starting point for operational decisions. The right platform surfaces which assets need attention, what is driving the signals, and where conditions are heading before they show up in monthly financial reports.
The metrics that matter most are the ones connected to revenue and occupancy outcomes, evaluated at the layout level rather than the property average, and viewed in combination rather than in isolation. The platform that supports that analysis well is the one that delivers current, connected, forward-looking visibility without requiring the team to assemble the picture before any analysis can begin.