Most multifamily operators already produce reports. The question is whether those reports are answering the right questions for the right audiences at the right frequency, or whether they are producing documentation that describes what happened without guiding what to do next.
A strong multifamily reporting template is not a fixed format. It is a framework that connects the right metrics to the right decisions, organized around who needs the information and when they need it to act on it effectively.
This article covers what a multifamily reporting template should include, how reporting needs vary by audience and frequency, and how the right platform infrastructure supports reporting that drives decisions rather than just documenting outcomes.
Related:
- Performance Analytics Software for Multifamily Portfolios
- Public Market Intelligence Platform for Multifamily: What to Look For
What Is a Multifamily Reporting Template?
A multifamily reporting template is a structured framework for organizing and presenting property and portfolio performance data in a consistent, repeatable format. It defines which metrics to include, how to organize them, and how frequently to review them, so that reporting produces a reliable operational picture rather than a different picture depending on who assembled it and when.
The value of a template is consistency. When the same metrics are tracked the same way across the same time periods, performance comparisons become meaningful and trends become visible. Without a consistent template, reporting tends to reflect what was easy to pull rather than what was most important to know.
What a Strong Multifamily Report Should Accomplish
A well-constructed multifamily report should do three things: show what is happening, explain why it matters, and point toward where attention or action is needed. Reports that only describe historical performance without connecting to forward conditions or operational priorities are documentation, not decision support.
Strong multifamily reporting is also organized around the audience receiving it. The metrics a property manager needs to run daily operations are different from the metrics an asset manager needs to evaluate portfolio performance, and both differ from what ownership needs to assess investment outcomes. A single report that tries to serve all three audiences equally usually serves none of them well.
Core Property Performance Metrics to Include in a Multifamily Report
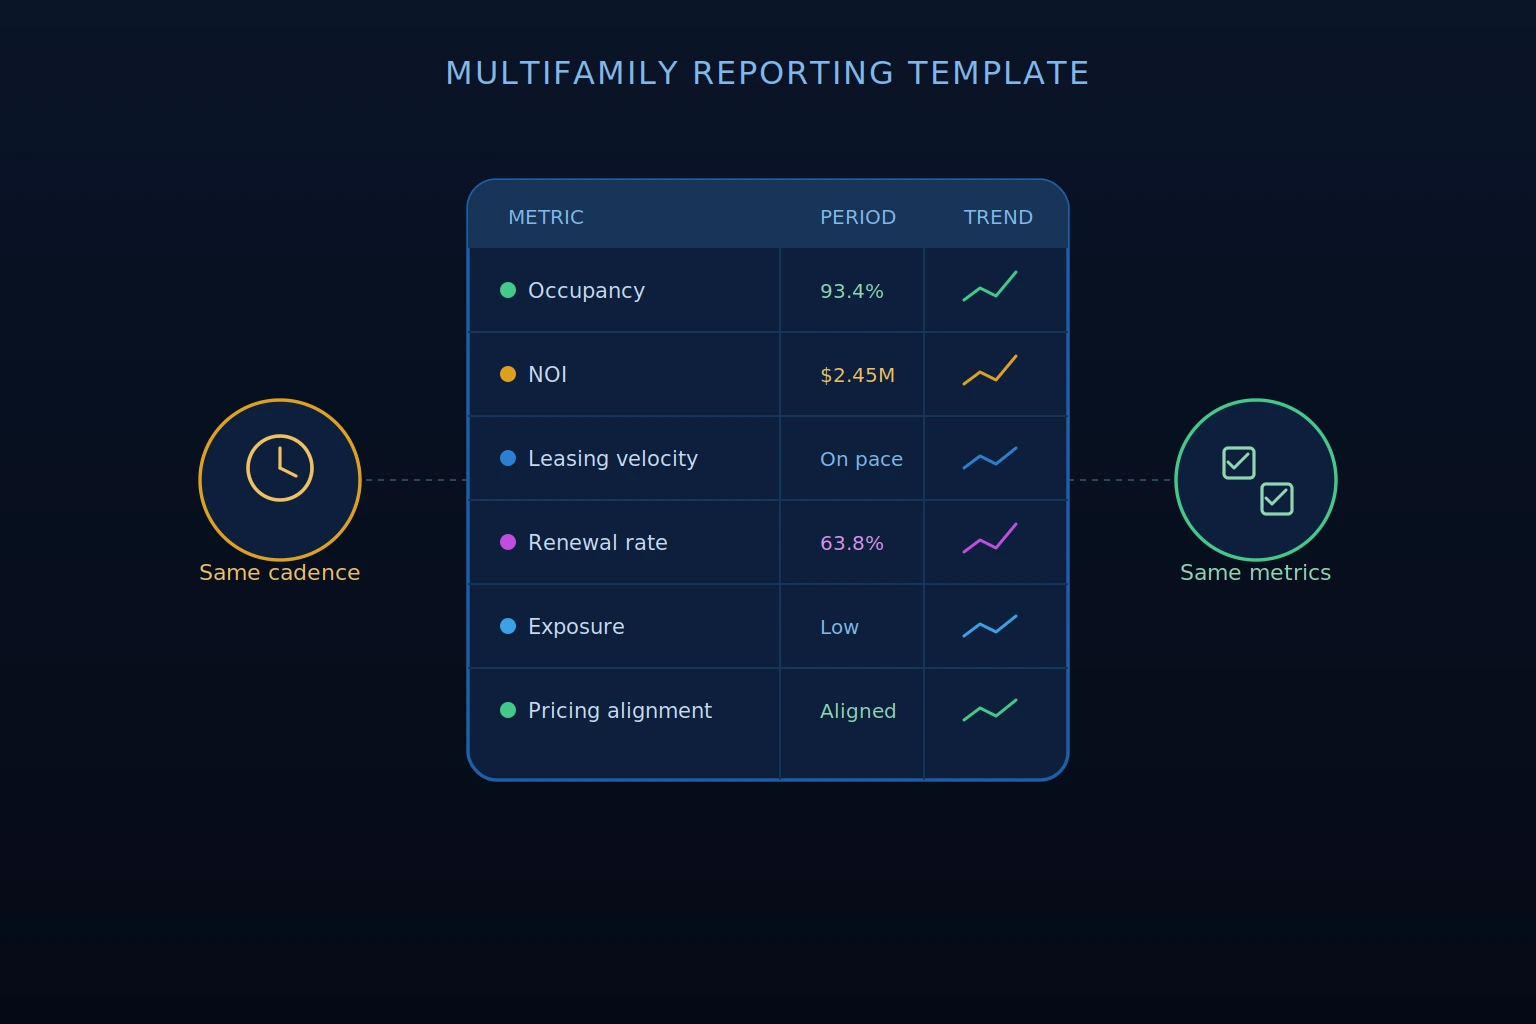
These are the foundational metrics that belong in any multifamily performance report, evaluated at the unit type or layout level where possible rather than only at the property level.
- Occupancy: Physical occupancy rate by layout compared against target and prior period
- Availability: Units currently available and coming available, including noticed units and month-to-month leases, not just vacant units
- Leasing velocity: Units leased per period by layout, evaluated against forward availability and occupancy targets rather than only as a standalone volume number
- Executed leases: The rents and lease terms being signed during the period, including the effect of concessions, providing a clearer view of achieved pricing rather than asking rent
- Renewals: Conversion rate by unit type and expiration window, trade-out between expiring and renewed rates, and outreach coverage on upcoming expirations
- Exposure: The forward distribution of scheduled lease expirations and known upcoming availability by layout and time window, with additional anticipated availability such as month-to-month behavior and early terminations incorporated based on historical performance
- Concessions: Concession usage, value, and prevalence by layout, and the impact on effective rent over the reporting period
- Loss to lease: The difference between the property’s current market rent and the rent being charged on occupied units, by layout where applicable
- Lease trade-out: The change between prior and new lease rates for both new leases and renewals, helping teams understand how signed lease economics are changing over time
- Rent roll and revenue trend: Changes in in-place rent and total scheduled rental revenue over time, helping teams understand whether revenue is growing, holding, or declining across the property and portfolio
Read Also:
- Multifamily Data Analysis: What It Is and Why It Matters
- Multifamily Revenue Management Strategies That Drive NOI
Leasing and Funnel Metrics
Leasing reports that only show total units leased miss the diagnostic information that makes the numbers actionable. Funnel metrics show where in the leasing pipeline activity is strong and where it is breaking down.
A complete leasing and funnel section should include:
- Inquiries by lead source and period
- Tour conversion rate from inquiry
- Application conversion rate from tour
- Lease signing conversion rate from application
- Average days on market by layout
- Lead source performance by downstream conversion, not only inquiry volume
When funnel conversion data is included alongside leasing velocity, the team can distinguish between a volume problem at the top of the pipeline and a conversion problem at a specific stage, which points toward a different operational response in each case.
Renewal and Expiration Reporting
Renewal reporting is where most multifamily reports are weakest. A single portfolio-level renewal conversion rate does not show where retention is softening, which layouts are at risk, or how upcoming expiration timing interacts with current leasing pace.
A complete renewal and expiration section should include:
- Renewal conversion rate by layout and expiration window for the current period
- Renewal conversion trend over rolling four to eight week periods to surface softening before it reaches occupancy
- Trade-out on renewed leases versus new leases by unit type
- Upcoming expirations by layout and month, with exposure concentration flagged where it exceeds configured thresholds
- Outreach coverage on leases expiring in the next 60 to 90 days
Revenue and Pricing Performance
Revenue reporting in multifamily should connect pricing decisions to their leasing outcomes rather than presenting pricing and revenue as separate topics.
According to CBRE's U.S. Real Estate Market Outlook 2026, because most widely reported rent growth figures are based on asking rents for new leases, they understate the actual performance of multifamily properties, with blended rent growth combining asking and renewal rents expected to remain higher than asking rent growth for new leases alone.
This is precisely why effective rent reporting, which reflects achieved lease pricing after concessions rather than advertised asking rent, is more operationally meaningful than asking rent data in any reporting framework.
A complete revenue and pricing section should include:
- Asking rent by layout compared with effective rent to show the impact of concessions and pricing adjustments on achieved lease pricing
- New lease and renewal trade-out by layout, showing how signed rents are changing relative to prior lease terms
- In-place rent and rent roll growth over time, showing how revenue is changing across the occupied portfolio
- Loss to lease by layout, showing where the largest gaps between the property’s current market rent and in-place rent exist
- Concession usage, value, and prevalence by layout and its impact on effective rent
- Pricing adjustment history connected to changes in leasing velocity
How Reporting Needs Change by Audience
The same data serves different purposes depending on who is reading it. Organizing reports by audience rather than producing a single report for everyone is what makes reporting genuinely useful rather than comprehensive but hard to act on.
Property management needs daily and weekly operational visibility: unit availability, maintenance status, leasing activity, outstanding follow-ups, and resident communication priorities. The time horizon is days and weeks. The decisions are operational and immediate.
Revenue management needs current and forward-looking performance data at the unit type level: leasing velocity against targets, pricing performance by layout, renewal conversion trends, exposure concentration, and funnel conversion by stage. The time horizon is weeks and months. The decisions are pricing, renewal offers, and leasing strategy.
Asset management needs portfolio-level visibility with the ability to drill into specific properties: where multiple conditions are shifting simultaneously, how assets are performing relative to targets and to each other, and where the forward performance picture warrants a strategy conversation. The time horizon is months and quarters. The decisions are asset strategy, capital allocation, and ownership communication.
Ownership needs a clear, concise view of investment performance: occupancy relative to target, NOI trajectory, significant performance changes and their causes, and where the asset stands relative to business plan objectives. The time horizon is quarters and hold periods. The decisions are investment strategy and capital deployment.
Top Picks:
Multifamily Reporting Template Frequency: Daily, Weekly, Monthly, Quarterly
Different metrics move at different speeds and warrant different review cadences. According to the National Apartment Association, since 2021 repairs and maintenance costs have risen nearly 28% while NOI has increased just 10%, compressing margins in ways that make the frequency and accuracy of performance reporting more consequential than it has been in years.
When operating costs are rising faster than revenue, the time lag between when a performance condition develops and when it surfaces in reporting directly affects how much of the margin the management team can protect.
Daily: Availability status, units leased and toured, outstanding follow-ups, urgent maintenance or leasing flags. Relevant primarily for property management and leasing teams during active leasing periods.
Weekly: Leasing velocity by layout, funnel conversion, renewal outreach coverage, pricing adjustments and their leasing response, forward exposure changes. Relevant for revenue management and property management.
Monthly: Full property performance review including occupancy, effective rent, loss to lease, concession impact, renewal conversion, and exposure forecasting. Relevant for asset management, revenue management, and ownership communication.
Quarterly: Asset-level business plan review, portfolio comparison, capital allocation evaluation, and ownership reporting on investment performance relative to objectives. Relevant for asset management and ownership.
How Rentana Supports Multifamily Reporting
Rentana connects PMS-sourced operational data into reporting infrastructure that supports each audience and frequency described above without requiring manual assembly before any report can be produced.
Overview dashboards provide a portfolio-level view of asset health that surfaces where properties need attention, supporting the daily and weekly prioritization that asset managers and revenue managers need without requiring a formal report to be built first.
Metrics Browser Metrics Browser enables flexible, on-demand analysis across more than 175 metrics by layout and time period.
Summary Dashboard provides a property-level view of the key pricing, leasing, occupancy, renewal, exposure, concession, and revenue metrics referenced throughout this article. Teams can configure timeframes and filter by layout or other available dimensions to move from a high-level performance view into more detailed analysis.
Leasing Demand and Conversion charts show lead volume and funnel performance across the leasing journey, helping teams evaluate where demand is coming from and where prospects are converting or dropping off.
Reports provide structured analysis across key areas such as available inventory, leasing activity and executed leases, lease compliance, trade-out, renewals, exposure, and target performance, with select reporting available at both the property and portfolio level.
Predicted Occupancy connects current leasing activity, renewal trends, and future availability to provide forward visibility into where occupancy is heading, adding the forward-looking dimension that static reporting cannot provide.
AI-generated Insights surface what is changing at specific assets, explain why it may matter given current operational conditions, and connect to a supported next step, so the analytical work of identifying what to report on is done before the team opens the platform.
Don’t Miss:
- How to Use Multifamily Rent Reporting: Complete Guide
- Multifamily Property Performance: 5 Key Metrics to Track
Conclusion on Multifamily Reporting Template
A multifamily reporting template is only as useful as what it prompts the team to do. Reports that describe historical performance without connecting to forward conditions, audience-specific priorities, or operational decisions are documentation. Reports organized around the right metrics for the right audience at the right frequency are a management tool.
The standard worth building toward is a reporting framework that consistently answers three questions: what is changing, why it matters, and where attention or action is needed. Everything else is formatting.