Multifamily operators have more data available to them than at any previous point in the industry's history. Leasing activity, occupancy trends, renewal behavior, pricing performance, forward availability, funnel conversion, and portfolio comparisons are all measurable and trackable in ways that were not practical even a decade ago.
The challenge has shifted from collecting data to working with it effectively. Having the numbers available and knowing what they are telling you are two different things. Leasing velocity without availability context is a volume count. Renewal conversion without forward exposure is a rate without consequence. Occupancy without a forward view is a snapshot with no direction.
According to Multi-Housing News, data is the cornerstone of any operational activity, and technological advances continue to fine-tune data gathering and processing systems, with continuous progress expanding the capacity to put data to practical use. The practical use is the part that matters most: turning operational data into insights that support pricing, leasing, renewals, occupancy, and asset strategy decisions before conditions have already shifted.
This article covers what multifamily data analysis actually means, what data is worth analyzing, how to connect signals across dimensions, and how the right platform infrastructure supports the kind of analysis that leads to better operational decisions.
Related:
What Is Multifamily Data Analysis?
Multifamily data analysis is the process of turning property and portfolio operational data into insights that support pricing, leasing, renewals, occupancy management, and asset strategy. The goal is to move from data that describes what happened to information that helps teams understand what is changing, where to focus, and what to do next.
For multifamily operators, this means working primarily with internal operational data, the activity happening inside the portfolio rather than external public market benchmarks alone. Occupancy, leasing velocity, renewal behavior, exposure, and pricing performance are all signals that connect to each other and to the decisions that determine how revenue and NOI perform over time.
According to the National Multifamily Housing Council, the multifamily industry generates significant volumes of operational data across leasing, maintenance, financial reporting, and resident communication, and operators who invest in the systems and processes to work with that data effectively are better positioned to make consistent, informed decisions across their portfolios.
What Data Should Multifamily Operators Analyze?
The most operationally useful multifamily data is internal, the activity happening at the property level that reflects actual leasing conditions, pricing performance, and forward availability. Public market data can provide useful external context, but it cannot substitute for the internal signals that explain how a specific asset is performing and where it is heading.
The internal operational data worth prioritizing:
- Occupancy and availability: Current physical occupancy by layout and property, alongside what is available or coming available, including noticed units and month-to-month leases
- Leasing velocity: How quickly available units are absorbing relative to targets and forward availability, tracked at the unit type or layout level rather than only at the property level
- Funnel conversion: Where in the leasing pipeline prospects are advancing and where they are dropping off, from inquiry through application to signed lease
- Executed leases and effective rent: The rents and lease terms being signed, including the impact of concessions, providing a clearer view of achieved pricing rather than asking rent
- Renewals: Conversion rates by unit type and expiration window, renewal offer timing, and trade-out between expiring and renewed lease rates
- Exposure and lease expirations: The forward distribution of scheduled lease expirations and known upcoming availability, with additional anticipated availability such as month-to-month behavior and early terminations incorporated based off of historical performance
- Concessions: Concession usage, value, and prevalence by layout, and how concessions are affecting effective rent over time
- Loss to lease: The difference between current property’s market rents and the rent being charged on occupied units, and where that gap is greatest across the rent roll
- Property and portfolio performance: Aggregated signals across properties that support prioritization and comparison rather than equal-weight review of every asset
Read Also:
- How to Prepare Multifamily Properties for Hurricane Season
- AI for Multifamily Rental Operational Efficiency
Why Looking at Individual Metrics Is Not Enough
Every metric in multifamily analysis carries more meaning when it is evaluated alongside the other signals it is connected to. A single number reviewed in isolation almost always leaves the most important part of the story out.
Leasing velocity is the clearest example. Eight units leased last month is a data point. Eight units leased last month against a forward availability picture showing sixteen units returning to market in the next 30 days, in a layout where the occupancy target is 95%, is an operational signal that points toward a specific decision. The velocity number is the same.
What it means is entirely different depending on what surrounds it.
The same principle applies across every metric in multifamily analysis:
- Occupancy without exposure context does not show where occupancy is heading
- Renewal conversion without forward availability does not reveal whether retention risk is building in a window that matters
- Effective rent without leasing velocity does not show whether pricing is producing the absorption pace the occupancy timeline requires
- Concession spend without loss-to-lease context does not show the full revenue impact of how units are being leased
- Property-level averages without unit-type breakdown do not surface where within the property conditions are diverging from the overall picture
The value of multifamily data analysis comes from connecting these signals so that patterns become visible and decisions become more specific. What changed? Why does it matter given the other conditions present? What should be done next? Those three questions together are what data analysis in multifamily should answer, and none of them can be answered by a single metric reviewed in isolation.
How Multifamily Data Analysis Supports Better Decisions
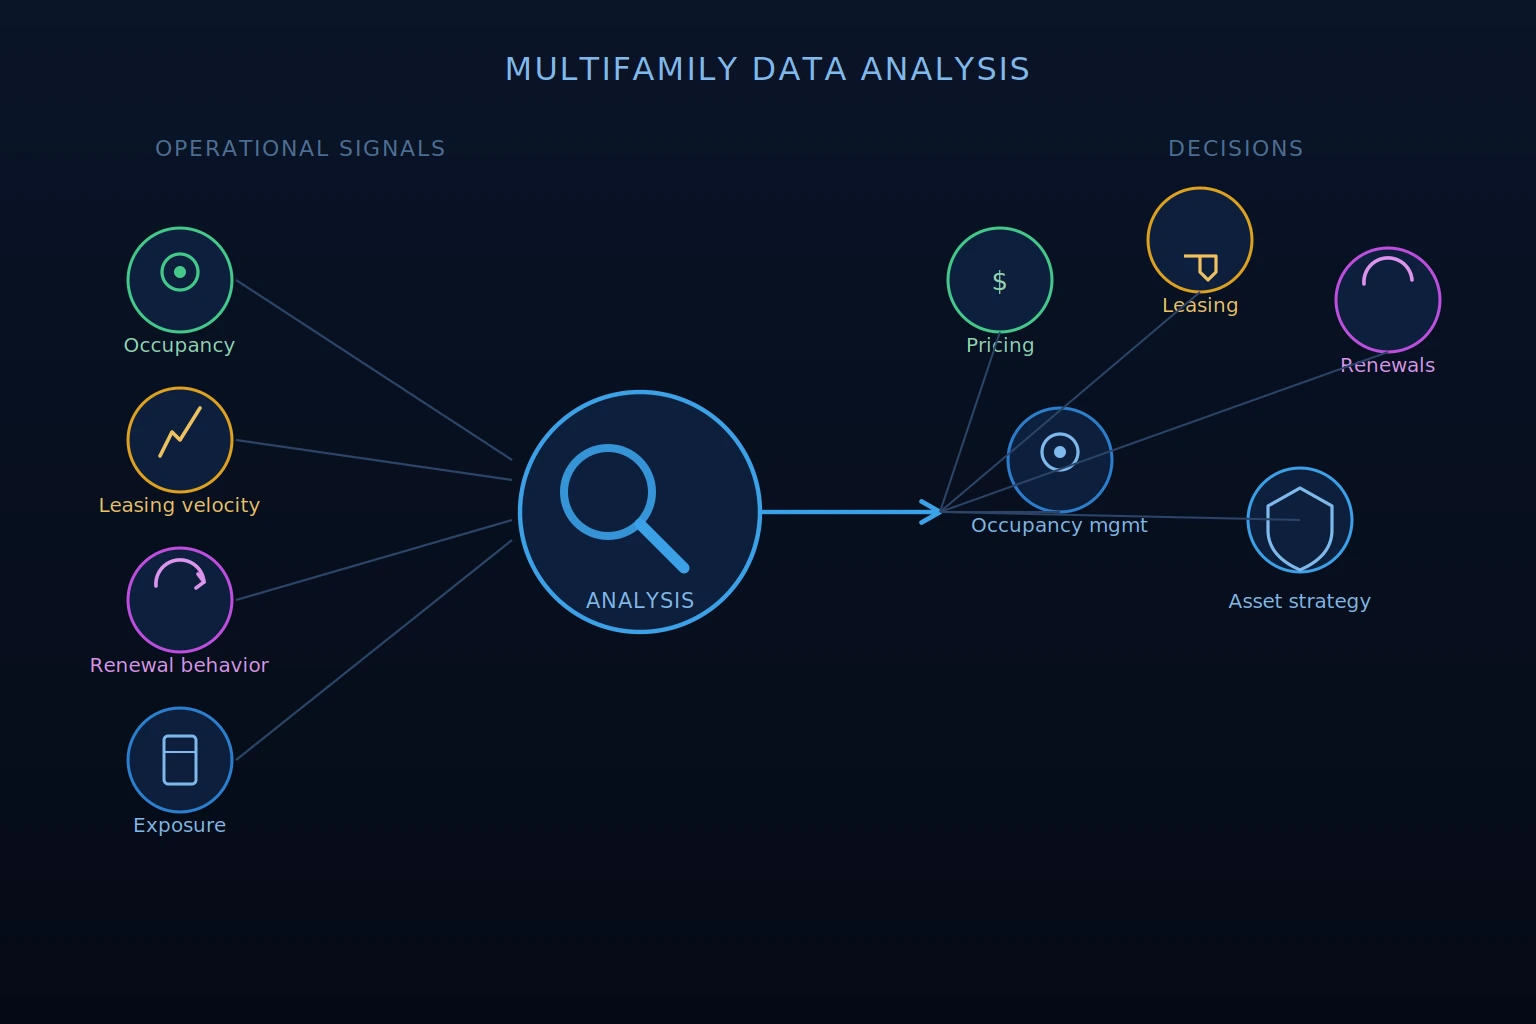
When operational data is connected and current, it changes the starting point for every operational decision rather than just adding more information to review.
Pricing decisions become more grounded when they reflect current leasing velocity and forward availability at the unit type level rather than public market averages from the last comp review. A pricing adjustment on a specific layout can be evaluated against what absorption has actually been doing in that segment, rather than relying primarily on broader public market benchmarks.
Renewal strategy becomes more targeted when renewal conversion is tracked by unit type and expiration window alongside the forward exposure picture. Knowing that two-bedroom conversion has been softening for six weeks in a window with high expiration concentration is different from knowing that renewal conversion was 68% last quarter.
Exposure management becomes proactive rather than reactive when the full forward availability picture, including notices, month-to-month behavior, and anticipated early terminations, is visible far enough ahead for a strategic response rather than a reactive one.
Marketing and leasing decisions become more efficient when funnel conversion data by stage and lead source shows which channels are producing residents who actually sign leases rather than which ones are generating the most inquiry volume.
Asset performance prioritization becomes possible when signals across the portfolio are evaluated simultaneously rather than sequentially, so the properties where multiple conditions are shifting together surface without requiring manual review of every asset to find them.
Property-Level vs. Portfolio-Level Analysis
Multifamily operators need both levels of analysis, and the decisions supported by each are different enough that neither can substitute for the other.
Property-level analysis is where the specific operational decisions live. Which layouts are absorbing below pace. Where renewal conversion is softening within the property. How effective rent is performing across layouts. What the forward exposure picture looks like for specific expiration windows.
These are decisions that require the granularity of unit-type and layout-level data rather than property averages that smooth out the differences that matter most.
Portfolio-level analysis is where prioritization and comparison happen. Which properties are drifting from performance targets. Where multiple conditions are shifting simultaneously across the portfolio.
How leasing velocity compares across assets in the same submarket. Which assets need focused attention this week and which are stable. These are questions that require aggregated, comparative data across properties rather than deep dives into any single one.
According to Multi-Housing News citing industry research, AI offers the potential for analysis of key data related to market and submarket conditions that can be leveraged to inform underwriting, budgeting, and operational decisions at the portfolio level.
For revenue and asset managers specifically, the ability to move between portfolio-level signals and property-level detail within the same analytical view, without requiring separate reports built from separate systems, is where much of the operational efficiency in modern multifamily data analysis comes from.
Related:
How AI Can Improve Multifamily Data Analysis
AI does not replace the judgment that multifamily data analysis requires. It changes what that judgment is applied to.
The practical value of AI in multifamily data analysis comes from three capabilities that manual processes cannot match at scale:
Pattern recognition across large datasets. A leasing velocity softening across multiple unit types simultaneously. A pricing misalignment creating friction in a specific layout. A renewal conversion decline that has been building for six weeks across a specific expiration window.
These patterns exist in operational data, but identifying them manually across multiple properties and multiple metrics requires more consistent attention than most teams can maintain alongside everything else they are managing. AI surfaces them faster and more consistently.
Connecting signals that belong together. The relationships between leasing velocity, renewal conversion, forward exposure, and pricing performance are not always obvious in individual reports. AI that analyzes these signals in combination, rather than presenting each one separately, surfaces the combinations that point toward specific operational conditions rather than individual data points that leave interpretation to the analyst.
Forward-looking context. Reporting describes what happened. AI-generated Insights can help teams interpret changes in current leasing activity, renewal trends, exposure, and forward availability so they can identify where performance may require attention. Forward-looking metrics and forecasting tools can then provide additional visibility into where occupancy and availability may be heading, while AI helps surface and explain the signals that matter.
Human judgment remains responsible for every strategy and action that follows from what AI surfaces. What changed, why it matters, and what to do next are questions that AI can help frame, but the decisions belong to the team.
How Rentana Supports Multifamily Data Analysis
Rentana is built around the analytical model described in this article. PMS-connected operational data, signals evaluated in combination rather than in isolation, and a forward-looking view of where performance is heading rather than where it has been.
PMS integration brings leasing, occupancy, and performance data into Rentana automatically so the operational picture is current before any analysis begins rather than assembled manually from periodic exports.
Dashboards give asset managers and revenue managers a shared, color-coded view of portfolio performance that surfaces where properties need attention without requiring sequential manual review of every asset.
Metrics Browser enables granular cross-portfolio analysis across more than 175 metrics by layout, property group, and time period, so specific performance questions can be investigated without rebuilding the analysis from scratch each time.
Reports consolidate operational performance data into structured formats that support ownership communication and asset-level review without requiring manual assembly from separate systems.
Predicted Occupancy connects current leasing activity, renewal trends, and future availability to provide forward visibility into where occupancy is heading at each asset, so teams are working from where performance is going rather than where it currently stands.
AI-generated Insights surface what is changing at specific assets, explain why it may matter given current operational conditions, and connect to a supported next step, so the analysis work of identifying what to pay attention to is already done before the team opens the platform.
Don’t Miss:
Conclusion on Multifamily Data Analysis
Multifamily data analysis is the practice of connecting operational signals into a picture that supports better decisions. Individual metrics describe what happened. Connected, current, forward-looking analysis shows what is changing, why it matters, and where to focus next.
The operators who get the most from their operational data are the ones who have built the infrastructure to evaluate signals in combination rather than in isolation, at the layout level rather than only at the property level, and with enough forward visibility that responses can be strategic rather than reactive.
Use Rentana to turn multifamily operational data into clearer, forward-looking revenue decisions.