
Multifamily performance cannot be evaluated through a single metric. Occupancy shows how many units are occupied today. Effective rent shows the lease pricing achieved after concessions. Leasing activity, renewal outcomes, and upcoming availability help teams assess whether current performance is likely to hold. Together, these measures provide a clearer picture of occupancy and revenue performance than any one number can offer.
Consistent measurement matters just as much as choosing the right metrics. The National Apartment Association highlights shared data definitions as a foundation for reliable reporting. When teams use consistent definitions and reporting periods, they can better understand differences across properties and evaluate results against each asset’s goals.
This article covers the key multifamily performance metrics, what each reveals, and how to interpret them together—from occupancy, leasing, and renewals to lease trade-out and longer-term rental revenue trends.
Related:
- Multifamily Reporting Template: What to Include and Why
- What is a Good Cap Rate for Multifamily Properties?
Why Multifamily Performance Needs More Than One Metric
The same result can reflect very different operating conditions. Two properties may both have 94% occupancy, but one has steady leasing, strong renewals, and limited upcoming availability, while the other has slowing leasing and a concentrated expiration window approaching. Their current occupancy is identical; the pressure they may face next is different.
Revenue metrics need the same context. Higher effective rents on newly signed leases may look encouraging, but if fewer units are leasing and vacancy is increasing, total rental revenue may still be under pressure. Conversely, strong occupancy should be evaluated alongside concessions, lease trade-out, and in-place rent trends to understand the economics supporting it.
Evaluating performance well means connecting current results with the operational signals that help explain them. Review metrics over consistent periods, investigate differences by layout, and assess results against each property’s targets and asset strategy. That gives teams a clearer basis for deciding where further investigation or action is needed.
Top 9 Metrics That Matter Most When Evaluating Multifamily Performance
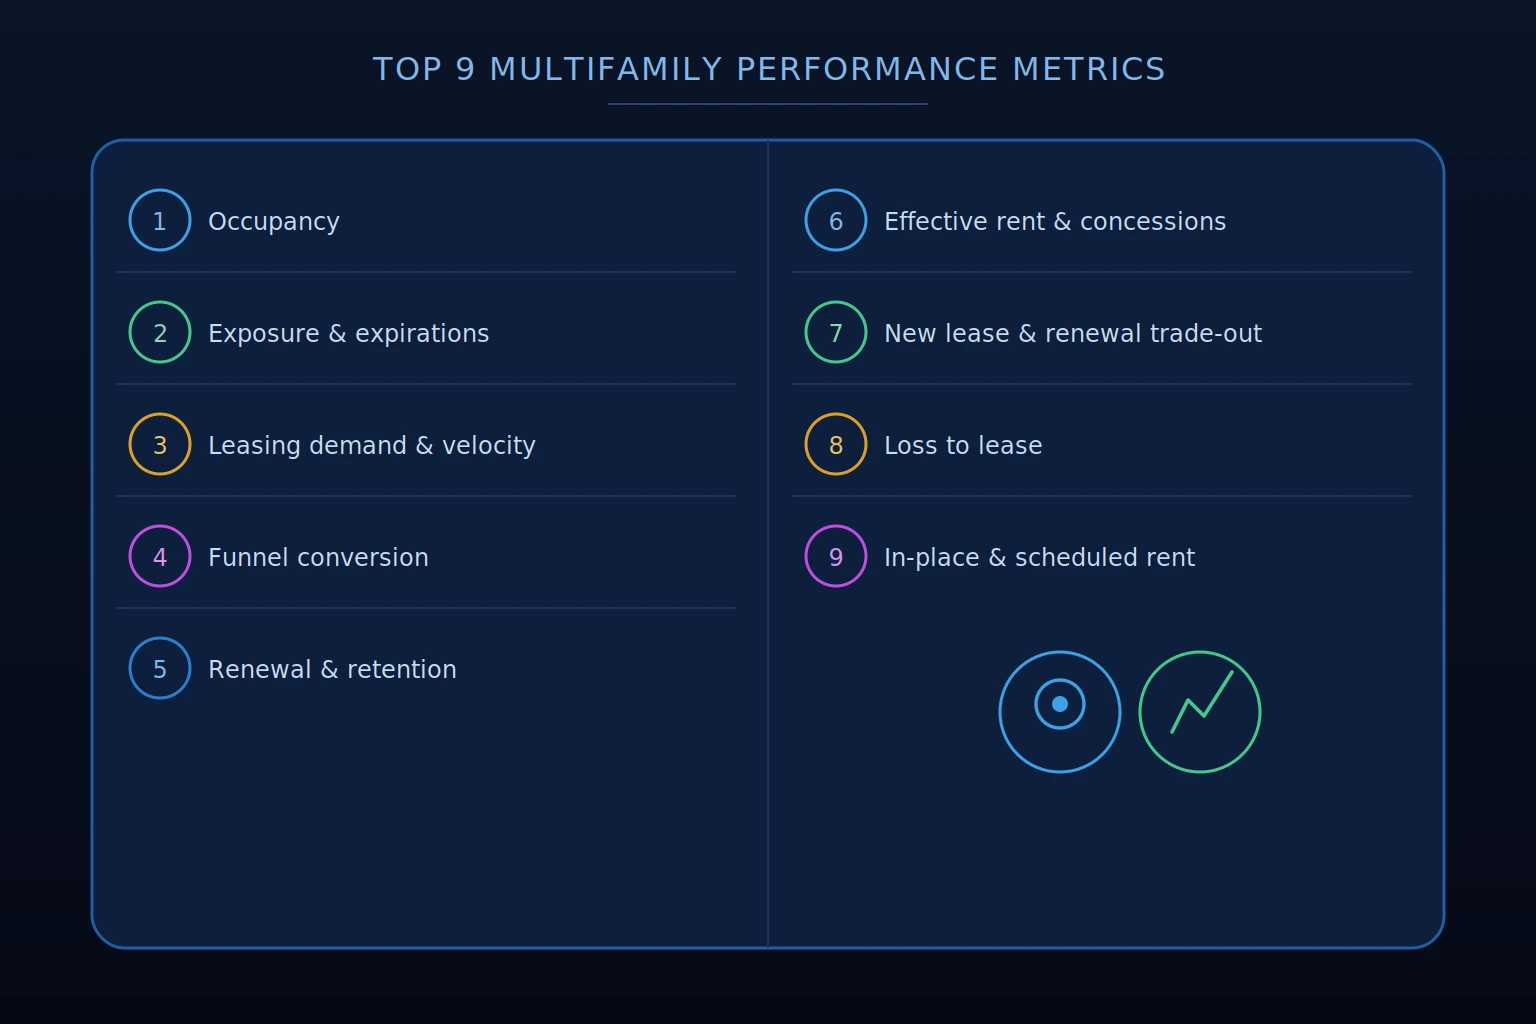
- Occupancy
- Availability, Exposure, and Lease Expirations
- Leasing Demand and Velocity
- Leasing Funnel Conversion
- Renewal Performance and Retention
- Effective Rent and Concessions
- New Lease and Renewal Trade-Out
- Loss to Lease
- In-Place Rent and Scheduled Rent and Revenue Trends
1. Occupancy
Physical occupancy measures the percentage of units occupied at a given point in time. It establishes the current operating baseline, but it does not explain the revenue those units generate or how occupancy may change as residents move in, renew, or leave.
Evaluate occupancy against the property’s targets and prior-period performance, then review it by layout. A property-wide average can conceal a layout with persistent vacancy alongside another with limited availability and steady leasing.
The next step is to connect current occupancy with leasing activity, renewal outcomes, and upcoming availability. A property meeting its occupancy target may still face pressure if move-outs are building faster than new leases are being signed. A property below target may be progressing toward its goal if signed leases support upcoming move-ins.
2. Availability, Exposure, and Lease Expirations
Availability and exposure help teams understand the inventory they need to lease now and the potential pressure ahead. Currently available units, confirmed notices, and scheduled lease expirations each contribute different information. An expiring lease creates a renewal decision; it does not necessarily mean the unit will become vacant.
Review scheduled expirations and known upcoming availability by layout and time window. Additional anticipated availability, such as month-to-month behavior and early terminations, can be incorporated based on historical performance, while remaining distinct from confirmed move-outs.
Expiration concentration matters because lease terms offered today shape future availability. When too many leases expire within a narrow window, especially during periods of weaker demand, the property may face added pressure if renewals and new leasing do not keep pace.
Compare expiration distribution with configured targets that reflect seasonal demand and asset strategy. Teams can use that view to evaluate new lease and renewal term options, prioritize outreach, and prepare for potential availability before it becomes vacancy.
3. Leasing Demand and Velocity
Leasing demand and leasing velocity answer related but different questions. Lead volume shows how much prospect interest a property is generating. Leasing velocity measures the pace of signed leases over a defined period. Reviewing both helps teams understand whether interest is translating into leasing activity at the pace the property needs.
Eight signed leases in a month means little without context. Teams also need to understand how many units remain available, what additional availability is expected, and when signed leases will become move-ins. Leasing pace should be evaluated against that inventory and the timeline for reaching occupancy targets.
Cushman & Wakefield’s Q2 2026 Multifamily MarketBeat reported falling vacancy as demand outpaced new supply over the preceding four quarters. At the property level, teams need to examine their own balance of leasing activity and available inventory, accounting for move-in timing, departures, and renewals to understand how signed leases may translate into occupancy.
Review demand and velocity over consistent periods and by layout where the data supports it. Consider seasonality and changes in available inventory: fewer signed leases may reflect fewer units available to lease, rather than weaker demand.
Declining lead volume may warrant a review of marketing reach and demand patterns. Steady interest with slower leasing calls for closer examination of funnel conversion, follow-up, unit readiness, lease terms, and pricing. These signals help teams decide where to investigate before choosing a response.
Related:
- Break-Even Occupancy in Multifamily: How to Calculate
- Top Multifamily Leasing Tips
4. Leasing Funnel Conversion
Leasing funnel conversion measures how prospects progress from inquiry through signed lease. Reviewing conversion at each stage helps teams distinguish a shortage of prospect interest from difficulty turning that interest into leases.
Healthy inquiry volume with few completed tours warrants a different investigation from strong tour activity with few applications. Scheduling availability, response times, follow-up, unit readiness, pricing, and lease terms may each influence results. A drop at one stage identifies where to investigate; it does not establish the cause on its own.
Use consistent stage definitions and allow enough time for prospects to progress before comparing conversion rates. Review conversion alongside prospect counts, lead sources, and leasing velocity so a small sample or a change in lead mix does not produce a misleading conclusion.
5. Renewal Performance and Retention
Renewal performance helps teams understand how successfully a property is retaining residents and how those outcomes affect future availability and revenue. Signed renewals can reduce turnover-related vacancy, make-ready expenses, and re-leasing work, while preserving continuity at the property.
Evaluate renewal outcomes by expiration window and layout, using a consistent definition of which leases are included. Keep signed renewals, confirmed departures, and pending decisions distinct. An upcoming expiration group with many unanswered offers should not be interpreted the same way as a completed group with a low renewal rate.
Review renewal performance alongside offer timing, outreach and follow-up status, renewal trade-out, and reasons for non-renewal. Resident feedback can help teams identify whether pricing, unresolved service issues, changing household needs, or other factors are influencing decisions.
Connecting those findings with forward exposure helps teams understand where potential departures could create occupancy pressure and where earlier outreach or strategy review may be useful.
6. Effective Rent and Concessions
Effective rent reflects the rent achieved on a signed lease after accounting for concessions over the lease term. It helps teams evaluate lease economics, but it is different from cash collected and does not, on its own, describe total property revenue or NOI.
For example, a 12-month lease at $2,000 per month with one month of free rent has an effective monthly rent of approximately $1,833, assuming no other rent adjustments. The advertised or face rent remains $2,000, but the concession changes the economics of the agreement.
Track concession usage, value, and prevalence by layout and leasing period. Evaluate effective rent alongside leasing velocity, occupancy, and lease term length to understand whether incentives are supporting the property’s strategy and how signed lease economics are changing.
CBRE reported average monthly rent growth of 0.5% year-over-year in Q4 2024. That headline figure does not show the lease economics achieved at an individual property. Tracking effective rent alongside concession usage helps teams understand whether changes in face rents are translating into stronger economics on signed leases.
Keep calculation methods consistent, particularly when comparing leases with different terms or concession structures. Review new leases and renewals separately before combining them into a broader performance view.
Read Also:
- Multifamily Occupancy Management: 7 Best Practices
- How to Forecast Occupancy in Multifamily Real Estate
7. New Lease and Renewal Trade-Out
Lease trade-out measures the change between the rent on a prior lease and the rent on the next lease for the same unit. New lease trade-out captures the change when a new resident leases the unit; renewal trade-out captures the change when an existing resident renews.
This adds context that effective rent alone cannot provide. Effective rent shows the economics of the current agreement, while trade-out shows how those economics changed from the prior agreement.
Use a consistent comparison basis. Face-rent trade-out compares rents before concessions, while effective-rent trade-out accounts for concessions across each lease term. Mixing those approaches can make growth appear stronger or weaker than it is.
Evaluate new lease and renewal trade-out separately, then review differences by layout and over time. Consider renovation status, lease terms, and the number of leases included. Positive trade-out on signed leases can coexist with revenue pressure from vacancy, so connect these results with occupancy and scheduled rental revenue trends before drawing conclusions about overall performance.
8. Loss to Lease
Loss to lease measures the difference between the property’s current market rent and the in-place rent charged on occupied units. Here, market rent means the property’s current rent for a comparable unit. This measure helps teams understand how rents across the occupied rent roll compare with current pricing.
For example, an occupied unit with an in-place monthly rent of $1,800 and a current market rent of $1,900 has a monthly loss to lease of $100. If in-place rent exceeds current market rent, the difference is commonly described as gain to lease.
Loss to lease does not include vacancy loss, unpaid rent, or every concession expense. Those affect revenue through separate measures. Use consistent rent definitions and account for differences in unit condition, amenities, and renovation status when evaluating the gap.
Review loss to lease by layout alongside expiration timing, renewal strategy, and lease trade-out. A gap does not mean an immediate increase is appropriate or achievable. Teams need to consider existing lease terms, retention, leasing conditions, and asset goals when evaluating how in-place rents may change over time.
9. In-Place Rent and Scheduled Rental Revenue Trends
In-place rent and scheduled rental revenue show how individual leasing and renewal outcomes accumulate across the property. Effective rent and trade-out explain the economics of signed agreements; rent roll trends help teams understand how those agreements are changing the broader revenue base.
Track average in-place rent alongside total scheduled rental revenue over consistent periods. Average rent can rise while total scheduled revenue falls if fewer units are occupied. Conversely, occupancy gains can increase scheduled revenue even when rents on individual leases remain relatively stable.
Define what scheduled rental revenue includes, particularly how concessions, vacant units, and non-rent charges are treated. Scheduled amounts are not the same as cash collected. Collections, delinquency, operating expenses, and NOI provide additional financial context.
Review these trends alongside occupancy, new lease and renewal trade-out, and concession usage. Account for changes in the unit mix, renovation downtime, or properties included in the analysis so comparisons remain meaningful. This helps teams assess whether current leasing and renewal decisions are supporting sustained revenue performance against the asset’s strategy.
Related:
- How to Calculate Occupancy Rate
- Lease-Up Strategy: How To Build Occupancy Without Creating Future Exposure
How to Evaluate Multifamily Performance at the Property and Portfolio Levels
Property-level analysis helps teams understand what is driving results and which actions warrant consideration. Portfolio-level analysis helps them decide where to focus attention and resources.
At the property level, start with performance against the asset’s goals, then investigate the layouts and leasing periods contributing to a change. If occupancy is falling, review upcoming availability, leasing pace, and renewal outcomes together. If scheduled rental revenue is weakening, examine occupancy, in-place rents, lease trade-out, and concessions to understand the contributing factors.
At the portfolio level, use consistent definitions and reporting periods to identify properties that need closer review. Compare each asset with its own targets and historical performance, accounting for differences such as lease-up stage, renovations, and unit mix. A stabilized property and a lease-up may require different responses even when they report similar occupancy.
The most useful review process connects these two levels: identify a portfolio priority, investigate the property-level drivers, assign an action, and revisit the results. This helps teams turn a shared set of metrics into focused decisions while keeping each property’s strategy in view.
How Rentana Brings Multifamily Performance Metrics Together
Rentana connects PMS-sourced operational data with reporting, forward-looking visibility, and AI-assisted analysis so teams can investigate performance and make informed decisions.
- Dashboards, charts, and reports give teams a shared view of pricing, leasing, occupancy, renewals, exposure, and revenue performance. Configurable timeframes and layout filters help teams move from property-level trends into the details behind a change.
- Metrics Browser supports analysis across layouts, custom unit groups, property groups, and time periods, helping teams investigate specific performance questions without assembling a new report for each review.
- Predicted Occupancy and exposure analysis provide forward-looking context alongside current results. Teams can review scheduled lease expirations against configured targets, known upcoming availability, and additional anticipated availability informed by historical performance.
- Purpose-built pricing recommendations by layout based on property-level performance signals, forward availability, and configured asset strategy. Supporting data and reasoning help teams evaluate each recommendation before deciding whether to act.
- AI-generated Insights highlight operational changes, explain why they may matter, and help teams identify where closer review is warranted.
- Ask Rentana, the AI analyst, lets teams ask questions about property and portfolio performance, including absorption, renewal conversion, concessions, and leasing conversion. Answers include explained reasoning, interactive charts and tables, and suggested next steps. Teams can download the analysis to share findings with colleagues and ownership.
Together, these capabilities help teams spend less time assembling information and more time evaluating what it means for each property’s strategy. Judgment and decisions remain with the people managing the assets.
You Might Like:
- 9 Challenges With Managing Multifamily Buildings (and How to Fix Them)
- The Role of AI in Forecasting Apartment Demand
Conclusion on Multifamily Performance Metrics
The most useful multifamily performance analysis connects occupancy and leasing activity with retention, lease economics, and revenue trends. Together, these metrics help teams understand current results, identify potential pressure, and evaluate where action may be needed.
Use consistent definitions and reporting periods, investigate differences by layout, and assess each property against its own targets and asset strategy. Connecting that analysis with forward availability gives teams more context for pricing, renewal, and lease term decisions—and a clearer way to evaluate whether those decisions are supporting long-term occupancy and revenue goals.