Occupancy is one of the most closely watched metrics in multifamily, but the percentage alone does not show how much financial flexibility a property has. An asset operating at 91% occupancy may be in a strong position if its break-even occupancy is 75%. If its break-even occupancy is 89%, that same performance leaves considerably less room for rising expenses, concessions, delinquency, or slower leasing.
According to Cushman & Wakefield’s Q2 2026 U.S. Multifamily MarketBeat, national vacancy declined to 8.9% as renter demand strengthened and new supply continued to pull back. However, occupancy and rent performance still vary by market, asset, and unit type. National trends provide useful context, but operators need property-specific metrics to understand the financial position of each asset.
Knowing how to calculate break-even occupancy in multifamily helps operators and investors identify the point at which property revenue covers the expenses and debt obligations included in the analysis. It also provides important context for evaluating the distance between the asset’s financial floor and its target occupancy.
Break-even occupancy should not replace an asset’s occupancy or rent targets. Instead, it helps teams understand how much cushion exists below those targets. When combined with forward-looking indicators such as exposure, lease expirations, projected retention, leasing velocity, and realized rent performance, it can support more proactive pricing, renewal, and inventory decisions.
This article explains how to calculate break-even occupancy, how to interpret the result, and how multifamily teams can use it to protect occupancy and revenue performance before financial pressure develops.
Related:
- Top 7 Multifamily Leasing Tips
- Occupancy Decline in Multifamily: How to Diagnose the Cause and Respond
What Is Break-Even Occupancy in Multifamily?
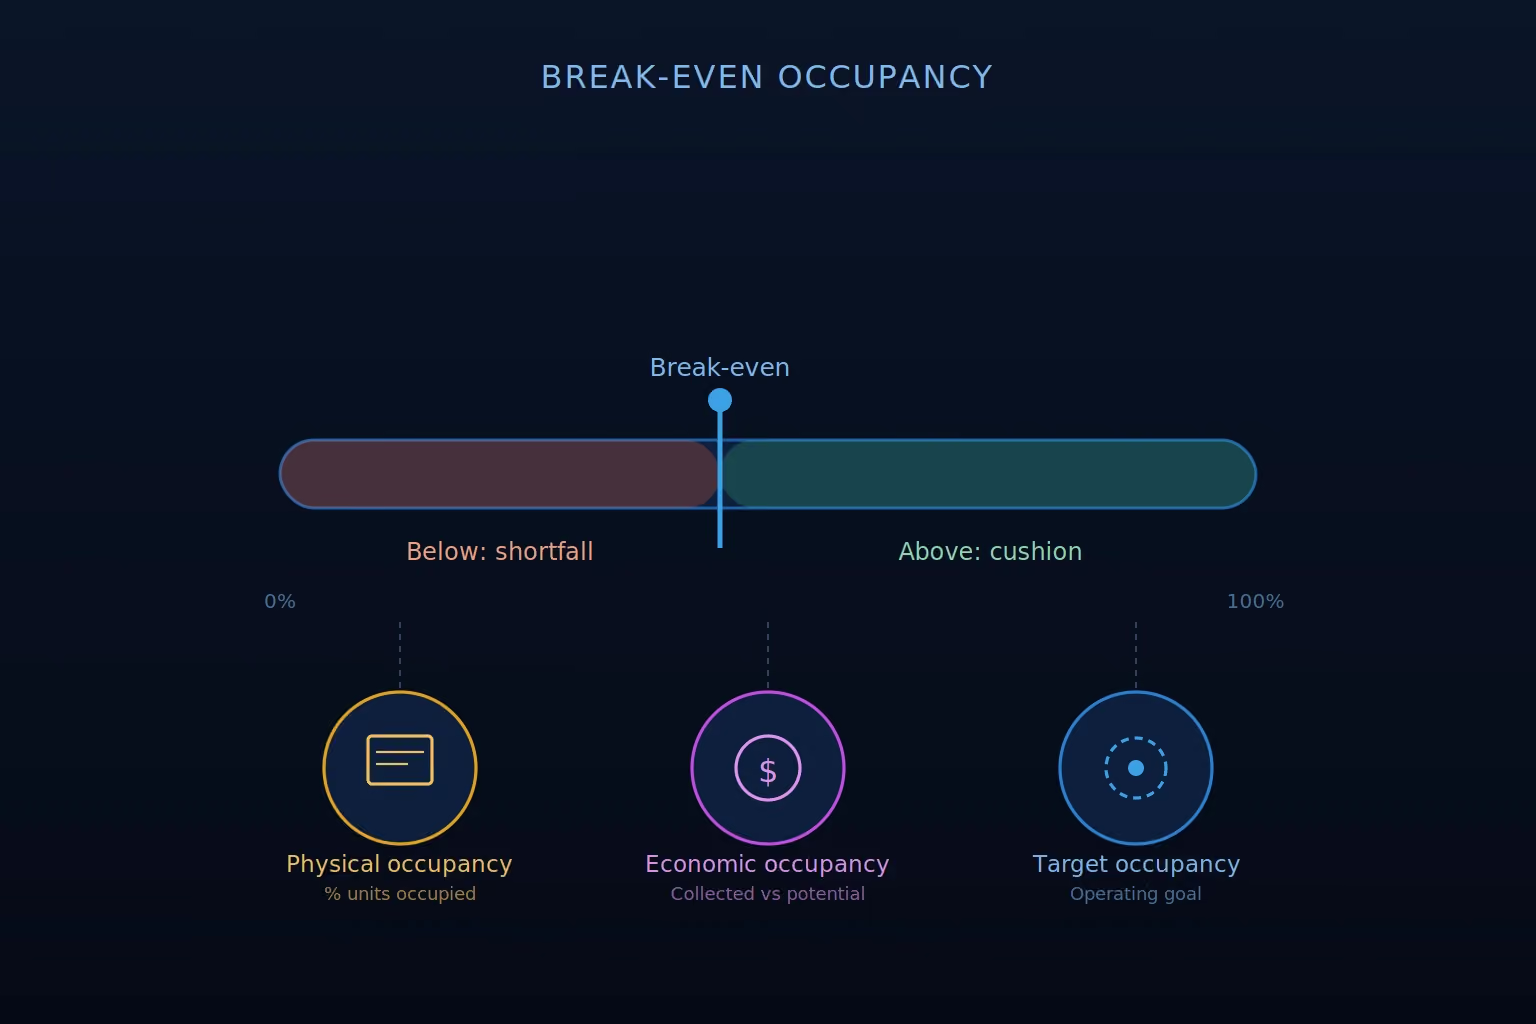
Break-even occupancy is the level of rental revenue a multifamily property needs to cover the operating expenses and debt obligations included in the calculation. Below this threshold, the property is not generating enough revenue to meet those costs. Above it, the asset has a financial cushion.
Break-even occupancy is usually expressed as a percentage of the property’s gross potential income. It is specific to the asset because it depends on factors such as rent levels, operating expenses, financing costs, and other recurring income.
It is important to distinguish break-even occupancy from two related metrics:
- Physical occupancy measures the percentage of units that are occupied.
- Economic occupancy compares the revenue actually collected with the revenue the property could have generated at full potential.
- Target occupancy is the operating goal established for the property or a particular unit layout.
Because units may have different rents (and because concessions, delinquency, loss to lease, and ancillary income affect collections), a break-even percentage does not always translate directly into the same percentage of occupied units. It is best understood as a revenue threshold and an estimated occupancy equivalent based on the assumptions used.
Two properties with the same number of units and the same physical occupancy can therefore have very different break-even positions. The property with higher expenses, greater debt service, or weaker realized rents will generally have less room between current performance and its financial floor.
How to Calculate Break-Even Occupancy: Formula and Examples
The break-even occupancy formula is: Break-Even Occupancy = (Annual Operating Expenses + Annual Debt Service) ÷ Gross Potential Income × 100
The result estimates the percentage of the property’s potential revenue needed to cover the costs included in the calculation.
What goes into each input:
1. Calculate Annual Operating Expenses
Include the recurring costs required to operate the property, such as:
- Property taxes and insurance
- Payroll and property management fees
- Repairs and maintenance
- Utilities paid by the property
- Marketing and administrative expenses
- Other recurring operating costs
Capital expenditures are generally evaluated separately from operating expenses. If the owner, lender, or asset-management team includes reserve contributions in its break-even analysis, that treatment should be applied consistently.
2. Add Annual Debt Service
Debt service includes the property’s total principal and interest payments for the year. Operators evaluating an unleveraged asset may calculate an operating break-even point without debt service, but that result should be clearly labeled because it answers a different question.
3. Determine Gross Potential Income
Gross potential income is the revenue the property could generate over a year under the assumptions used in the analysis. It generally includes potential rental income and may include recurring ancillary revenue from sources such as parking, storage, pets, and utility reimbursements.
Teams should apply consistent assumptions when including ancillary income. Some revenue changes with occupancy, while other income may remain relatively stable. Concessions, delinquency, and loss to lease should also be evaluated separately so the resulting percentage is not mistaken for an exact physical occupancy requirement.
Top Picks:
- Understanding Predicted Occupancy Trends in Multifamily
- Multifamily Occupancy Management: 7 Best Practices
4. Divide Required Costs by Potential Income
Add annual operating expenses and debt service, divide that amount by gross potential income, and multiply the result by 100.
The resulting percentage represents the property’s estimated break-even revenue threshold. Translating it into a required number of occupied units may require a more detailed calculation when unit rents, concessions, and collection performance vary significantly.
Example of Break-Even Occupancy in Multifamily
Consider a 150-unit multifamily property with the following annual financial assumptions:
- Average scheduled monthly rent per unit: $1,600
- Gross potential rental income: 150 × $1,600 × 12 = $2,880,000
- Operating expenses: $950,000
- Debt service: $620,000
First, calculate the property’s total required revenue:
$950,000 + $620,000 = $1,570,000
Then apply the break-even formula:
Break-Even Occupancy = $1,570,000 ÷ $2,880,000 × 100
Break-Even Occupancy = 54.5%
Under these simplified assumptions, the property must generate approximately 54.5% of its potential rental income to cover its operating expenses and debt service.
If every unit had the same rent and all billed rent were collected, this would be roughly equivalent to 82 occupied units. In practice, the required unit count may be higher because unit rents vary and concessions, delinquency, loss to lease, and collection performance can reduce realized revenue.
The calculation should therefore be treated as a financial threshold rather than a guarantee that a specific physical occupancy percentage will produce break-even cash flow.
How Rising Costs Change Break-Even Occupancy
Break-even occupancy is not a fixed property characteristic. It changes when operating expenses, debt service, rent assumptions, or other income change.
Using the same property, assume operating expenses increase by 15% and annual debt service rises following a refinance:
- Revised operating expenses: $1,092,500
- Revised debt service: $780,000
- Gross potential rental income: $2,880,000
The revised calculation is:
Break-Even Occupancy = ($1,092,500 + $780,000) ÷ $2,880,000 × 100
Break-Even Occupancy = 65%
The property must now generate approximately 65% of its potential rental income to cover the costs included in the calculation, compared with 54.5% previously. Its break-even threshold has increased by 10.5 percentage points.
The same effect can occur if potential income declines because of lower rents or if realized revenue is reduced by concessions, delinquency, or loss to lease. Recalculating break-even occupancy when the property’s cost structure, financing, or revenue assumptions change gives operators a more accurate view of how much financial cushion remains.
What Is a Good Break-Even Occupancy Rate?
There is no single break-even occupancy rate that is appropriate for every multifamily property. The result depends on the asset’s operating costs, financing structure, rent levels, age, market, and investment strategy.
In general, a lower break-even occupancy rate provides more room to absorb vacancy, concessions, delinquency, expense increases, or temporary rent pressure. A higher rate means the property must generate a greater percentage of its potential income before it covers its required costs.
The percentage is most useful when compared with:
- Current physical and economic occupancy
- The property’s target occupancy
- Realized rent performance
- Historical operating results
- Underwriting and lender assumptions
- Break-even results under stressed revenue and expense scenarios
For example, an asset operating at 92% occupancy has a different risk profile when its break-even threshold is 65% than when the threshold is 88%. The smaller the distance between current performance and break-even, the less room the property has to absorb weaker leasing, lower collections, or rising costs.
Operators should also confirm that comparisons use the same methodology. A break-even calculation that includes debt service and reserve contributions should not be compared directly with one that excludes them. Consistent assumptions are essential for evaluating changes over time or comparing properties across a portfolio.
Read Also:
How to Use Break-Even Occupancy in Operational Decisions
Break-even occupancy identifies the property’s financial floor, while target occupancy defines the performance level the asset is working to maintain. The goal is not to manage a property as close to break-even as possible. It is to use pricing, renewal, and inventory decisions to preserve sufficient distance between current performance and that threshold.
Rentana allows teams to configure occupancy and rent targets, compare target rents with realized rents, and monitor the factors influencing performance. Its insights help teams understand what is changing, why it matters, and which actions they can consider before occupancy or revenue pressure becomes more difficult to correct.
1. Manage Lease Expirations to Protect Future Occupancy
Current occupancy may appear stable even when the property’s expiration schedule is creating future risk. If too many leases expire during the same period, available supply can exceed expected demand, increasing exposure and placing additional pressure on rents and concessions.
Expiration management helps teams distribute future availability more intentionally. Rentana supports this process by incorporating expiration considerations into dynamic pricing, allowing teams to evaluate not only the revenue and occupancy impact of a lease today, but also when that lease will return to inventory.
Maintaining a healthier lease expiration schedule can reduce concentrated vacancy risk and support more balanced supply and demand over time. This gives the property a better opportunity to remain near its occupancy target and comfortably above its break-even threshold.
2. Align Renewal Strategy With Occupancy and Rent-Growth Goals
Renewal decisions affect both future occupancy and realized rent growth. Retaining more residents can reduce exposure and turnover costs, but the appropriate renewal approach depends on the asset’s occupancy position, revenue goals, projected retention, and upcoming availability.
A property with limited occupancy cushion may place greater emphasis on retention. An asset that is comfortably exceeding its occupancy target may have more flexibility to pursue rent growth. The strategy may also vary by layout when some unit types have stronger demand or less future exposure than others.
Rentana’s configurable renewal strategies help teams balance occupancy and rent-growth objectives based on the needs of the asset. By considering projected retention, expiration timing, and performance against configured targets, teams can evaluate renewal pricing before future vacancy pressure becomes visible in current occupancy.
This creates a more deliberate connection between renewal decisions and the property’s financial position. Rather than applying the same approach to every resident or unit type, operators can align renewal strategy with the areas where retention or rent growth is most important.
3. Apply Pricing and Concessions Where Performance Requires Them
When occupancy is below target, operators need to determine which revenue lever is most appropriate. A price reduction or a targeted concession may both support leasing, but they affect realized rents and the longer-term rent roll differently.
Property-wide reductions can create unnecessary rent erosion when the performance issue is concentrated within particular layouts or inventory groups. Rentana allows teams to configure occupancy targets and evaluate performance at the layout or custom unit-group level. This helps identify where pricing pressure is developing and where demand remains strong enough to protect rents.
Teams can then consider pricing changes or concessions for the inventory that needs additional support while avoiding broader adjustments to unit types that are already meeting their targets. Comparing target rents with realized rents also shows how concessions, negotiations, and other adjustments are affecting actual revenue performance.
Any pricing or concession strategy should be applied according to consistent, documented criteria and applicable fair housing requirements. Used carefully, a more targeted approach can support occupancy where needed without unnecessarily weakening the property’s overall rent roll or longer-term revenue performance.
Related:
- Apartment Concession Strategy: When and How to Use
- Rent Concession Meaning & Examples
4. Act on Forward-Looking Performance Signals
Break-even occupancy is a financial boundary, not a point operators should wait to reach before taking action. By the time current occupancy has fallen close to that threshold, the property may have fewer options and less time to correct its performance.
Forward-looking indicators can reveal pressure before it appears in current occupancy. These include:
- Future exposure and lease-expiration concentrations
- Projected resident retention
- Leasing velocity and conversion trends
- Upcoming unit availability
- Seasonal changes in demand
- Performance against occupancy and rent targets
Rentana brings these signals together to help teams identify what is changing and which factors are having the greatest effect on target performance. Its insights also provide context on why those changes matter and the next steps teams can consider.
This advance visibility gives operators time to adjust pricing, renewal strategy, expiration management, or leasing focus while the property still has a meaningful cushion above break-even. The objective is not simply to respond to an occupancy decline, but to recognize developing risk early enough to protect both occupancy and realized revenue.
A Note About Break-Even Occupancy During Lease-Up
During lease-up, reaching the required occupancy is only part of the objective. Teams also need to consider how today’s lease terms will shape future expirations.
If too many early leases expire while the property is still working toward stabilization, the team may have to manage a wave of renewals and potential move-outs while continuing to lease the remaining vacant inventory. That can slow occupancy growth and make it more difficult to maintain the performance needed for refinancing.
Lease-term and expiration management can help distribute future availability more intentionally. Rentana supports this process through dynamic lease-term pricing and expiration management, helping teams evaluate how each new lease contributes to both near-term occupancy and the property’s longer-term expiration schedule.
The goal is to build occupancy without creating a future concentration of expirations that puts stabilization at risk. Break-even occupancy remains an important financial reference point, but during lease-up, the timing and durability of occupancy, and its alignment with applicable refinancing requirements—matter just as much.
Conclusion on How to Calculate Break-Even Occupancy in Multifamily
Break-even occupancy helps multifamily operators understand the amount of revenue an asset needs to cover the expenses and debt obligations included in the calculation. It establishes the property’s financial floor and shows how much cushion exists between that threshold and current performance.
The metric should be recalculated whenever operating costs, financing, rents, or other revenue assumptions change. It should also be evaluated alongside physical occupancy, economic occupancy, realized rents, and the property’s configured performance targets rather than used as a standalone measure.
Rentana helps teams monitor the forward-looking factors that can affect that cushion, including exposure, expirations, projected retention, leasing velocity, and performance against occupancy and rent targets. With earlier insight into what is changing and why, operators can make more focused pricing, renewal, concession, and expiration-management decisions before financial pressure reaches the break-even threshold.