Real estate generates enormous volumes of operational data. Leasing activity, occupancy conditions, pricing performance, renewal trends, expiration calendars, and portfolio comparisons all produce signals that determine how assets perform and where risk is developing. The challenge has never been access to that data. It has been the capacity to process it consistently enough to evaluate what is changing before conditions have already shifted.
AI-driven property analytics addresses that gap by analyzing property, portfolio, leasing, pricing, occupancy, renewal, and operational data to identify patterns, risks, and opportunities faster and more consistently than manual reporting alone.
Related:
- AI-Powered Rental Property Pricing: How It Works
- Performance Analytics Software for Multifamily Portfolios
What Is AI-Driven Property Analytics in Real Estate?
AI-driven property analytics is the use of artificial intelligence to analyze property, portfolio, leasing, pricing, occupancy, renewal, and operational data to identify patterns, risks, and opportunities faster than manual reporting allows.
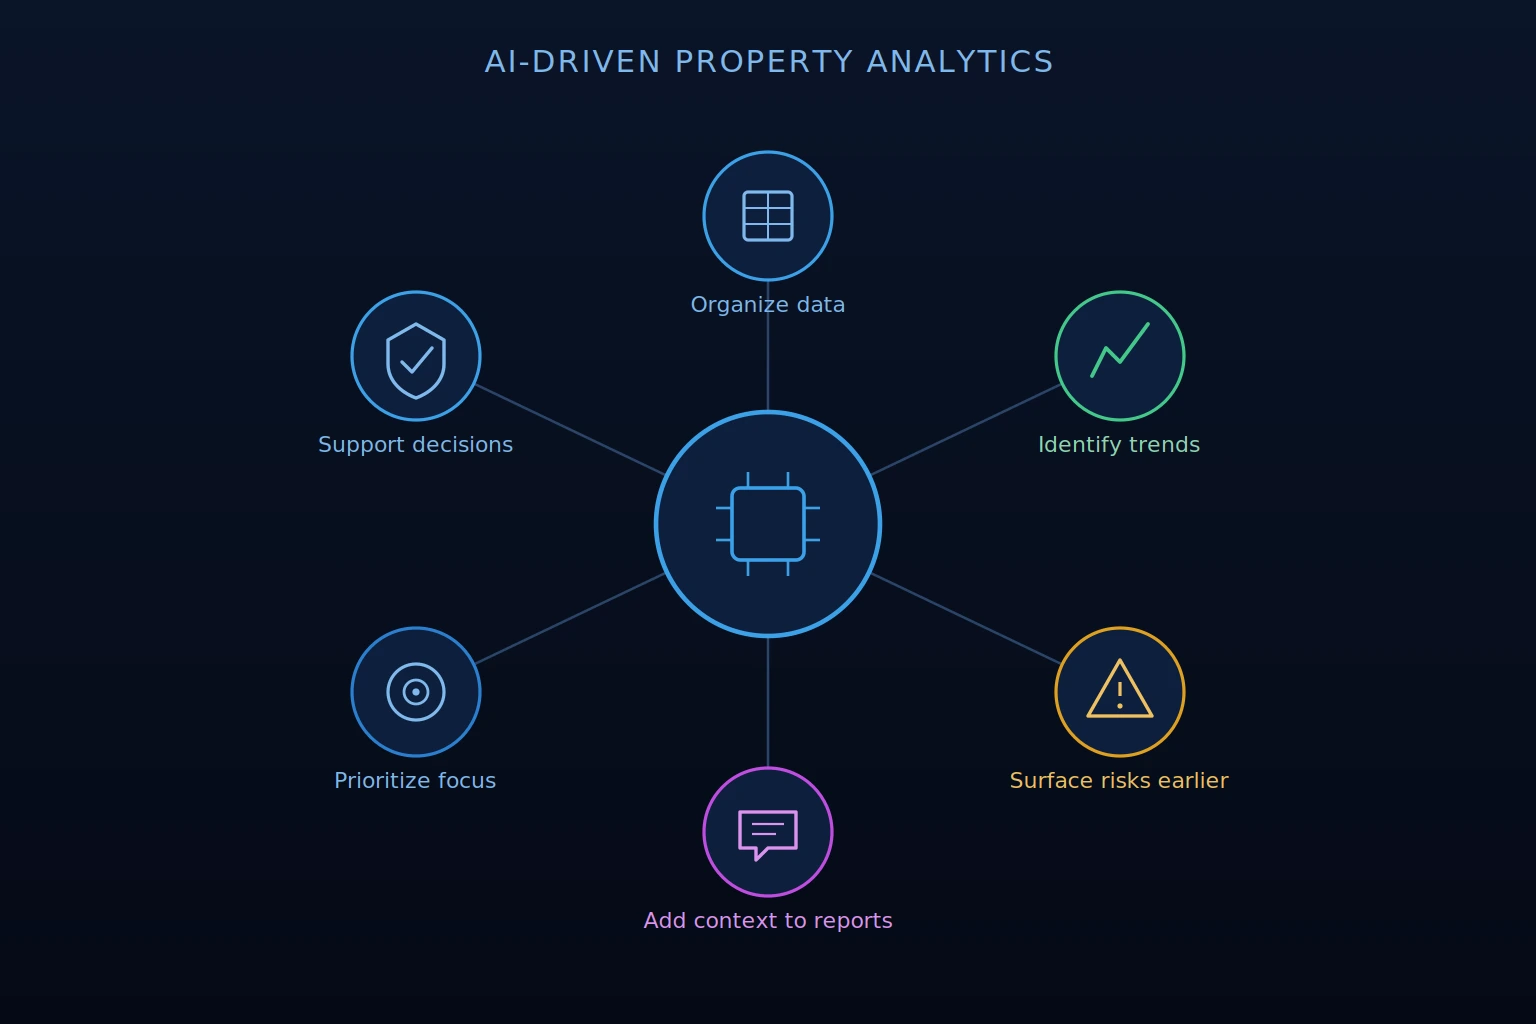
The core functions it performs:
- Organizes property performance data from connected sources into a consistent, current operational picture rather than a manually assembled snapshot
- Identifies trends and changes in leasing velocity, renewal conversion, occupancy conditions, and pricing performance as they develop rather than after they show up in financial reports
- Surfaces risks earlier by evaluating connected signal combinations that point toward developing conditions, not single metrics reviewed in isolation
- Adds context to reports by explaining what is changing, why it may matter given current operational conditions, and where teams may need to investigate further
- Helps teams prioritize where to focus across a portfolio by surfacing where multiple conditions are shifting rather than presenting every metric with equal weight
- Supports better asset, revenue, and operational decisions by providing more complete and current information before the decision is made
How AI Property Analytics Differs From Traditional Reporting
Traditional reporting describes what happened. It shows where occupancy stood at the end of the reporting period, what leases were executed, and what revenue was collected. That information is accurate and useful for documentation. It is organized around the past rather than around where conditions are heading.
AI-driven property analytics is organized around three different questions: what is changing, why it may matter given current operational conditions, and where teams may need to investigate further.
Leasing velocity is always a retrospective signal. The value of AI analytics is not that it turns past activity into a prediction by itself, but that it connects that signal to forward availability, occupancy goals, lead demand, and renewal trends. That context helps teams evaluate whether a slowdown is an isolated historical result or an early indicator of future occupancy risk.
The Data AI Property Analytics Can Analyze
The most operationally useful property analytics draws primarily from internal operational data rather than external market estimates. The data categories that matter most:
- Occupancy and availability: Physical occupancy by layout alongside what is available and coming available
- Leasing velocity: Absorption pace by layout relative to forward availability and occupancy targets, not only as a standalone volume number
- Lead and conversion performance: Where in the leasing pipeline prospects are advancing and where they are dropping off, by stage and by layout
- Pricing changes: Pricing movement and recommendations connected to leasing velocity, demand, and forward occupancy context
- Renewal performance: Conversion rates by layout and expiration window over rolling periods, trade-out between expiring and renewed lease rates
- Lease expirations and exposure: The forward distribution of upcoming availability by layout and time window
- Target tracking: How current performance compares against configured occupancy and revenue targets, by property and across the portfolio
- Public market context: Publicly advertised asking rents, availability, and specials as external calibration, incorporated as one input alongside internal signals
- Portfolio performance: Cross-property comparison of leasing, occupancy, renewal, and pricing conditions to support prioritization and strategy conversations
Top Picks:
- How To Do A Rental Market Analysis Like a Pro (With AI Tools)
- AI Tool for Public Rental Market Analysis by Zip Code
How AI Property Analytics Supports Asset Managers
Asset managers overseeing multiple properties need two things simultaneously: a portfolio-wide view of where conditions are shifting and the ability to move quickly from a portfolio signal to the property-level and layout-level detail driving it.
AI property analytics supports asset managers by surfacing where assets are drifting from plan without requiring sequential manual review of every property. When leasing velocity is softening, renewal conversion is declining, and forward exposure is concentrating at a specific asset, that combination can surface as a connected signal rather than requiring the asset manager to notice the pattern across separate reports on separate schedules.
Asset managers can use AI analytics to compare property performance against targets and other assets in the portfolio, evaluate developing occupancy risk before it reaches financial reporting, and understand where operational follow-up or strategy adjustment may be needed while there is still time to respond.
How AI Property Analytics Supports Revenue Managers
Revenue managers need the same connected view of operational signals but with deeper focus on the specific conditions that drive pricing, leasing, and renewal decisions day to day.
AI property analytics supports revenue managers by connecting pricing recommendations to current leasing demand, forward availability, exposure conditions, renewal trends, and predicted occupancy rather than presenting each signal as a separate analytical exercise. A pricing decision made with visibility into current leasing velocity, upcoming expiration concentration, and where occupancy appears to be heading under current conditions is a more informed decision than one made from a manually assembled comp survey and a month-end occupancy report.
Targeted lead rate analysis helps revenue managers evaluate whether current demand volume is sufficient to meet occupancy goals based on recent conversion performance. When lead demand is falling short of what the occupancy timeline requires, that signal can surface alongside pricing and availability context so the revenue manager has a more complete picture before deciding how to respond.
Examples of AI Property Analytics Insights
The most useful AI property analytics insights do more than describe a metric that moved. They connect related signals and point the team toward the condition that may need evaluation. Examples of the kinds of insights AI analytics should be able to surface:
- Demand risk by layout: Lead volume, leasing velocity, or funnel conversion weakening for a specific unit type
- Forward occupancy risk: Upcoming availability, expiration concentration, or exposure building in a future time frame
- Pricing and positioning risk: Pricing that may need review based on demand, conversion, availability, and publicly available market context
- Renewal and retention risk: Renewal performance, resident feedback, or loss-to-lease conditions that may require closer monitoring
- Operational or amenity risk: Review themes, amenity feedback, or service-related signals that may affect demand or retention
- Asset performance risk: A property trending away from target across multiple signals, not just one metric moving in isolation
Each of these is a starting point for the revenue manager or asset manager to investigate further, not a directive to act. The insight surfaces the signal and provides context, while the judgment about what it means and what response is appropriate belongs to the team.
Related:
- How Do Property Owners Identify Underpriced Units in a Rental Portfolio?
- Best Rental Property Software for Landlords
Why AI Analytics Still Requires Human Judgment
AI property analytics surfaces patterns, adds context, and helps teams prioritize where to focus. It does not replace the judgment, strategy, compliance review, and decision accountability that remain essential to responsible property management and investment.
AI outputs depend on data quality, model design, and the assumptions embedded in the system. A property analytics platform working from inconsistent PMS data, incomplete lease records, or stale availability information will produce outputs that reflect those limitations. Data quality at the source is the prerequisite for reliable AI-driven analytics, not an optional follow-up concern.
How to Evaluate AI Property Analytics Software
The criteria that matter most when evaluating a property analytics platform:
- PMS integration: Direct connection to the PMS so data is current before any analysis begins rather than assembled from periodic manual exports
- Transparent AI-generated explanations: Insights that explain what is changing and why it may matter, not just dashboards that present metrics without context
- Forward-looking occupancy visibility: Predicted Occupancy or equivalent forward signal that shows where occupancy appears to be heading under current conditions
- Portfolio and property-level reporting: The ability to move between a portfolio-wide prioritization view and property or layout-level detail within the same platform
- Pricing and renewal context: Pricing recommendations with reasoning attached and renewal conversion tracking connected to forward exposure conditions
- Exposure management: Lease expiration concentration surfaced by layout and time window, with forward visibility into upcoming availability
- Target tracking: Performance evaluated against configured occupancy and revenue targets rather than only against prior period actuals
- Scheduled reporting: The ability to configure recurring report delivery so consistent information reaches the right teams on the right cadence without manual assembly
- Shared team visibility: A shared operational view that gives leasing, revenue management, and asset management teams access to the same current data simultaneously
How Rentana Supports AI-Driven Property Analytics
Rentana property and portfolio data through a set of AI-powered analytical capabilities organized around what is changing, why it may matter, and where teams may need to investigate further.
AI-generated Insights surface what is changing at specific assets, explain why it may matter given current operational conditions, and help teams understand where to focus. They are organized around the three questions that drive useful analytics: what changed, why it matters, and where to investigate further.
Predicted Occupancy connects current leasing activity, renewal trends, and future availability into a forward view of where occupancy is heading at each asset, supporting earlier evaluation of whether current performance is tracking toward property goals or diverging from them.
Pricing recommendations by layout connect leasing velocity, forward availability, exposure conditions, and property goals into a supported pricing evaluation with reasoning attached.
Target Tracking evaluates current performance against configured occupancy and revenue targets by property, giving asset managers and ownership groups a consistent view of where each asset stands relative to plan.
Exposure management surfaces where lease expiration concentration is building by layout and time window, helping teams evaluate forward availability before it creates avoidable occupancy pressure.
Renewal visibility helps teams evaluate retention trends by layout, renewal pricing in the context of current leasing conditions, and where renewal strategy may need adjustment given forward exposure and occupancy goals.
Scheduled reporting allows available reports to be configured for automatic recurring delivery, keeping leasing teams, revenue managers, asset managers, and ownership groups consistently informed without manual assembly.
Portfolio dashboards give asset managers a portfolio-level view of performance across properties, surfacing where multiple conditions are shifting without requiring sequential manual review.
Lease-Up Mode supports lease-up properties with data-backed planning, forecasting, AI insights, and pricing recommendations aligned to the property’s path to stabilization, while helping teams keep future occupancy risk in view as leases are signed.
Don’t Miss:
- 7 Best AI Tools for Multifamily Property Management
- Multifamily Property Data: 5 Metrics Operators Should Actually Track
Conclusion on AI-Driven Property Analytics in Real Estate
AI-driven property analytics changes the starting point for operational and investment decisions. When the analytical work of identifying what is changing, connecting related signals, and surfacing what matters is handled before the team opens the report, the time available for judgment, strategy, and response is fundamentally different from what manual processes allow.
The value is not in replacing the decisions that property and asset management require. It is in improving the information available when those decisions are made.
Use Rentana to turn multifamily property data into AI-powered insights that support pricing, occupancy, renewals, exposure management, and asset performance decisions.