Leasing activity is one of the clearest indicators of where multifamily performance is heading, but it is often reviewed too narrowly.
Most teams track the basics: traffic, tours, applications, leases, and units leased last month. Those numbers are useful, but they do not tell the full story on their own. Leasing activity becomes operationally valuable when it is evaluated against forward availability, occupancy targets, and funnel conversion.
The question is not simply, “How much leasing activity did we have?” The better question is, “Do we have enough leasing activity, and is it happening in the floorplans where we need it, to support the occupancy target given what is coming back to market?”
That context is often hard to see because the data is fragmented. Multifamily analysts spend 80% to 90% of their time collating data and only 10% to 20% actually analyzing it. That ratio describes the problem with how many teams monitor leasing activity: too much time goes into assembling the numbers, and not enough time is left to understand what the numbers are pointing toward.
This article explains what leasing activity measures, which signals operators should monitor, and how to respond when leasing activity is not keeping pace with the asset’s availability and occupancy timeline.
Related:
- Lease-Up Strategy: How To Build Occupancy Without Creating Future Exposure
- Best Leasing Solutions for Managing Multiple Multifamily Assets
What Does Leasing Activity Measure?
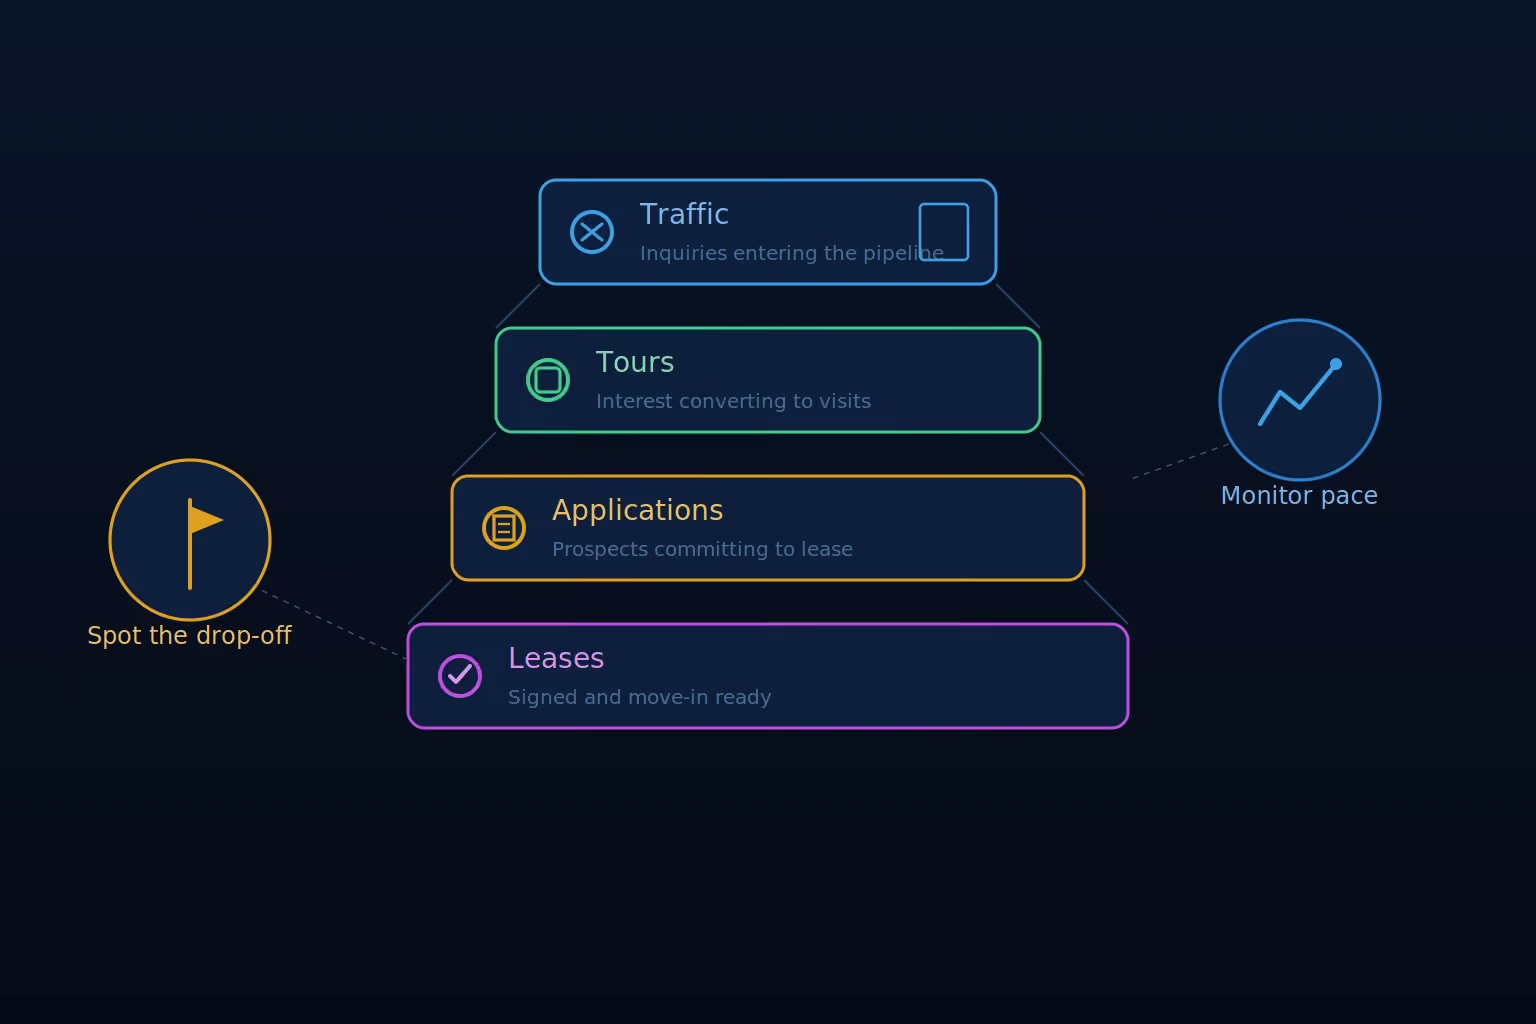
Leasing activity measures the volume and pace of prospect engagement, applications, and lease signings at a property or across a portfolio. It includes the full leasing funnel, from first inquiry through signed lease.
The metric is most useful when it is evaluated as a set of signals rather than a single number. Traffic, tours, applications, and leases each answer a different question about where demand is entering the pipeline, where prospects are converting, and where activity may be breaking down.
Volume vs. Pace
The most common mistake in leasing activity monitoring is treating volume and pace as the same thing.
Eight units leased last month is a volume number. Eight units leased last month against a forward availability picture showing fourteen units coming back to market in the next 30 days is a pace problem.
Pace is the more useful operating signal because it connects what is happening to what needs to happen. A property needs leasing activity strong enough to keep up with, or outpace, the rate at which units are returning to market.
When leasing velocity falls below that pace, the gap can build toward an occupancy problem. The earlier the team sees that gap, especially by layout, the more options they have to respond.
Leasing Activity as a Leading Indicator
Leasing activity is one of the clearest early signals of where occupancy is heading.
A slowdown in leasing velocity for a specific layout can show up in occupancy several weeks later. A drop in inquiry-to-tour conversion can show up later as weaker application volume. A decline in application-to-lease conversion can signal pricing, follow-up, or closing issues before they appear in the signed lease count.
That is why leasing activity should be reviewed before the occupancy problem is visible. The numbers are not just a record of what happened. They are an early indication of where performance may be heading.
When teams monitor leasing activity by layout, funnel stage, and forward availability, they can identify where demand is softening, where prospects are dropping off, and where the leasing pace may not be strong enough to support the occupancy target.
Top Picks:
How to Monitor Leasing Activity Effectively
Effective leasing activity monitoring should show where the leasing pipeline is strong, where it is breaking down, and whether current activity is happening in the layouts where the property needs it most.
The goal is not to review every leasing metric in isolation. The goal is to connect leasing activity to the availability and occupancy timeline the asset is working toward.
1. Leasing Velocity by Layout
Property-level leasing velocity can hide the differences that matter most.
A property leasing twelve units per month may look healthy overall, but the picture changes if most of those leases are concentrated in one-bedroom layouts while two-bedroom availability is building. The total leasing number may be strong, while the specific layouts creating exposure are still underperforming.
Track leasing velocity by layout and compare it against forward availability for each group. A layout absorbing below pace with a concentration of upcoming availability is a specific operational problem that requires a specific response.
What to look for: Leasing velocity should be strong enough in the layouts where availability is building. If the property has traffic but not in the layouts that need activity, the issue may be marketing focus, pricing, product positioning, availability timing, or lead source quality.
2. Funnel Conversion by Stage
Leasing velocity shows how many units are being leased. Funnel conversion shows where prospects are moving forward and where they are dropping off.
Each stage of the funnel points to a different operational issue:
- Strong inquiry volume but low tour conversion may indicate a response-time, first-impression, or scheduling issue.
- Strong tour activity but weak application conversion may indicate a pricing, follow-up, product positioning, or competitive issue.
- Strong applications but weak lease signing may indicate friction in the approval, closing, lease-signing, or move-in timing process.
Review funnel conversion by stage so the team can respond to the actual problem instead of reacting broadly to a weak leasing number.
What to look for: Identify the stage where conversion is softening. The right response depends on whether the issue is traffic generation, tour conversion, application conversion, or lease signing.
3. Lead Source Performance
Not all traffic has the same value.
A lead source that produces high inquiry volume but low conversion may create activity without producing signed leases. Another source may generate fewer inquiries but stronger downstream conversion. Looking only at traffic volume can cause teams to overvalue channels that are not producing qualified demand.
Review lead source performance by both volume and conversion. The goal is to understand which sources are producing prospects who move through the funnel, not just which sources are producing the most leads.
What to look for: Watch for sources where lead volume and conversion move in opposite directions. High volume with low conversion may indicate poor lead quality, mismatched marketing, pricing friction, or a weak handoff between inquiry and tour.
Recommended:
- The Best Lease Renewal Software for Real Estate
- Lease Renewal Agreement: How to Manage The Entire Process Easily
4. Days on Market by Layout
Days on market by layout is one of the most actionable leasing activity signals because it shows where demand may be softening before the issue becomes a broader occupancy problem.
A layout averaging 35 days on market while comparable layouts are averaging 18 is sending a specific signal about pricing, product positioning, marketing, availability timing, or demand for that layout. That signal can be hidden in property-level averages.
Review days on market alongside days vacant. A unit that markets slowly has a different problem than a unit that generates interest but remains vacant because of timing, application, approval, or make-ready issues.
What to look for: Identify layouts with consistently higher days on market or days vacant. Then compare those patterns against amenities, pricing, concessions, lead source activity, tour volume, and upcoming availability.
How to Improve Leasing Activity When It Is Lagging
When leasing activity signals show a gap between current pace and what the occupancy timeline requires, the response should match the cause of the gap. The goal is not to react broadly to a weak leasing number. The goal is to identify where the pipeline is breaking down and respond there.
Diagnose Before Responding
The most common leasing activity mistake is responding before identifying which stage of the pipeline is driving the issue.
A pricing adjustment will not fix a response-time problem. More marketing spend will not fix weak tour conversion. A concession may create short-term activity without solving the layout, lead quality, follow-up, or closing issue behind the slowdown.
Start with the funnel. If inquiry volume is healthy but tour conversion is low, the issue may be response time, scheduling friction, first impression, or showing quality. If tour volume is healthy but application conversion is low, the issue may be pricing, follow-up cadence, product fit, availability timing, or competitive alternatives. If applications are strong but lease signing is soft, the issue may be approval friction, lease-start flexibility, closing process, or a competing offer.
Talk to the leasing team. Leasing agents are closest to the prospect conversations and often hear the friction points before they appear clearly in the data. They may know whether prospects are objecting to price, layout, availability date, concessions, parking, pet policies, application requirements, move-in costs, or a competing property’s offer.
Review whether the issue is concentrated in a specific layout. If one layout is lagging while others are performing, the response should be specific to that layout rather than applied broadly across the property.
Targeted Responses by Stage
Low inquiry volume points toward marketing reach, listing quality, ILS performance, pricing position, or lead source mix. The response should start with marketing visibility and positioning before assuming the issue is purely price.
Low tour conversion points toward response time, scheduling friction, the first interaction, or the quality of the virtual or in-person showing experience. AI-assisted leasing tools can help close response-time gaps, especially after hours or on weekends, but the showing experience itself still requires human evaluation.
Low application conversion after strong tours points toward follow-up cadence, pricing competitiveness, product fit, urgency creation, or whether the prospect is finding a better option after touring. The response should focus on what happens between the tour and the application.
Low lease signing after approval points toward friction in the closing process, lease-start date flexibility, approval timing, or a competitor making a stronger offer before the lease is signed. Reducing the time between approval and signing request is often the most direct response at this stage.
How Rentana Supports Leasing Activity Monitoring and Improvement
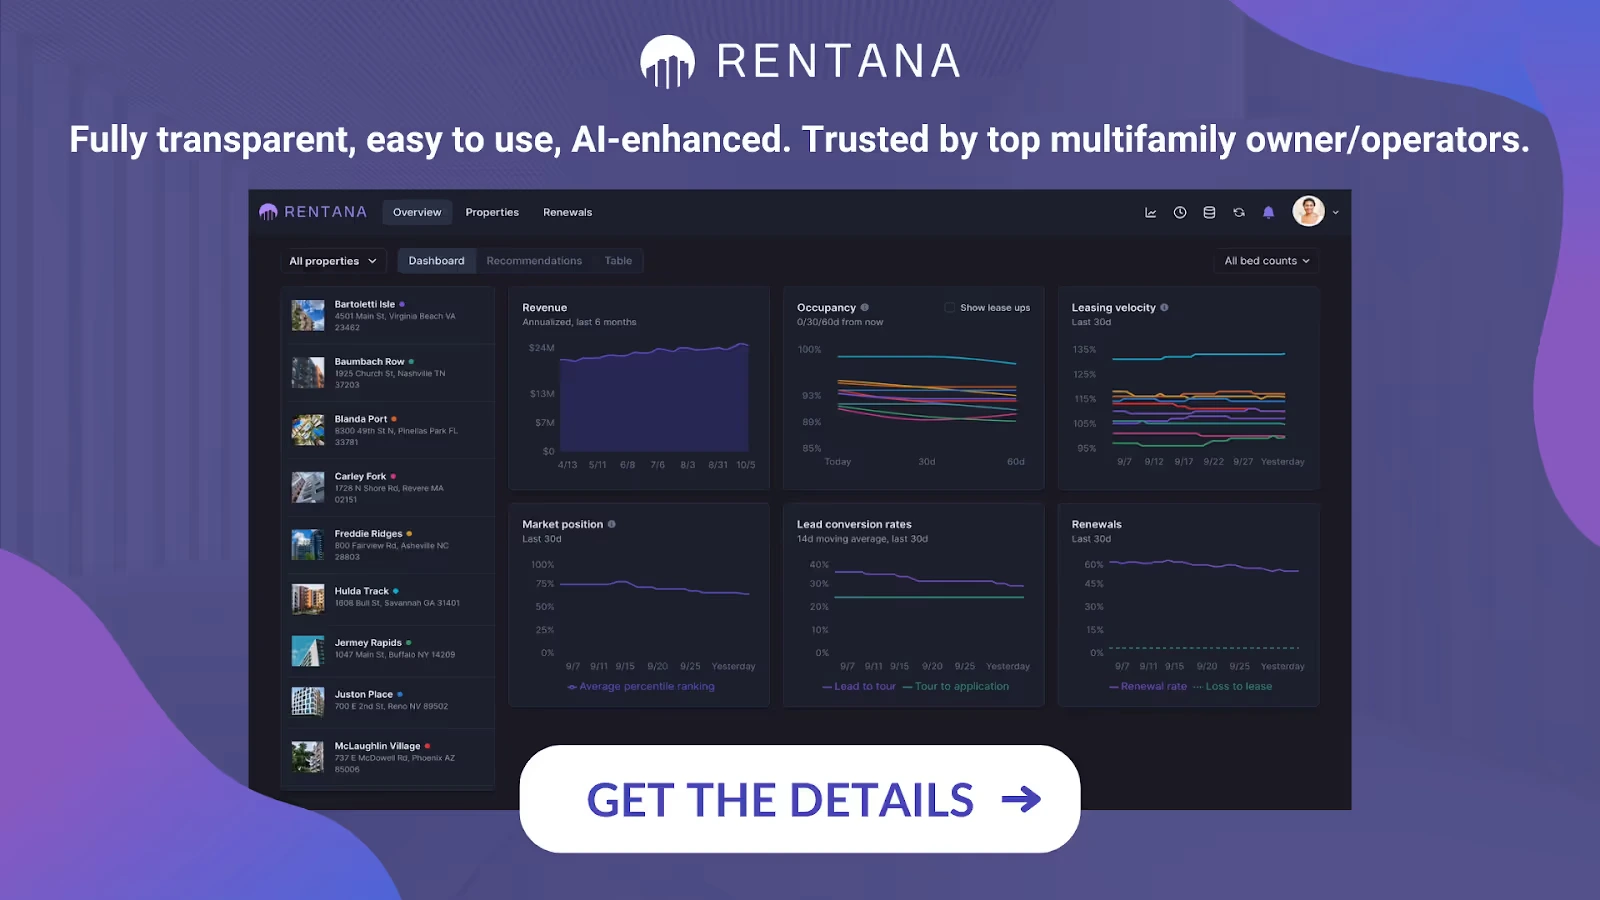
Rentana helps teams monitor leasing activity by connecting current leasing velocity, funnel conversion, forward availability, and occupancy targets in one operating view.
Instead of reviewing leasing activity as a backward-looking count, teams can see whether current pace is strong enough to support the occupancy target given what is coming back to market. Leasing velocity by layout helps surface where activity is concentrated, where demand is softening, and where exposure may be building.
Rentana also helps teams take a more proactive approach to marketing and leasing focus. By showing upcoming expirations and periods of potential overexposure, teams can identify where greater demand may be needed before the issue appears in trending occupancy numbers. Marketing teams can use that visibility to adjust spend, lead source focus, or campaign timing toward the layouts and time periods where demand will matter most.
Predicted occupancy connects current leasing activity, renewal trends, and future availability to show where occupancy is anticipated under current conditions. If leasing velocity is running below the pace needed to maintain occupancy within the target range, the team has more lead time to evaluate the cause and respond.
Portfolio dashboards and shared team visibility also help leasing managers, revenue managers, operations leaders, and asset managers work from the same current picture. When a leasing activity signal appears at a specific asset or layout, the relevant teams can review it together instead of waiting for a manually assembled report.
Don’t Miss:
- How to Achieve Stabilized Vacancy
- Unit-Level Pricing Strategy in Multifamily
Conclusion on Leasing Activity
Leasing activity is most useful when it is connected to decisions, not just reported as a set of numbers.
Traffic, tours, applications, and leases show what is happening in the pipeline. But the real value comes from understanding whether that activity is strong enough, whether it is happening in the layouts where demand is needed, and whether it is keeping pace with forward availability and occupancy targets.
When leasing activity is monitored by layout, funnel stage, lead source, days on market, and upcoming exposure, teams can see where performance is softening before it becomes an occupancy problem. That visibility gives leasing, marketing, revenue management, and asset management teams more time to respond with the right action instead of reacting broadly after the gap has already appeared.
The goal is not more reporting. The goal is earlier diagnosis, better coordination, and leasing activity that supports the asset’s occupancy timeline.