NOI is where operating decisions turn into dollars. Pricing, vacancy, renewals, and leasing follow-through each move revenue or expenses, and AI helps operators see those decisions earlier and with more context. The financial result depends on how the team acts on what it sees.
This article shows how management decisions translate into dollars through simple hypothetical comparisons, and how leading indicators connect to financial results. The examples are illustrative and are not Rentana performance claims.
Related:
- Multifamily Revenue Management Strategies That Drive NOI
- How Will AI Affect the Real Estate Industry?
How Does AI Improve NOI in Real Estate?
NOI is effective operating revenue minus operating expenses. AI can support NOI improvement by helping operators make better-informed decisions about pricing, vacancy, renewals, leasing efficiency, and operational costs.
The influence is indirect. AI surfaces patterns and context, and NOI changes through the management decisions and execution that follow.
How AI Supports NOI in Real Estate: 6 Operational Levers
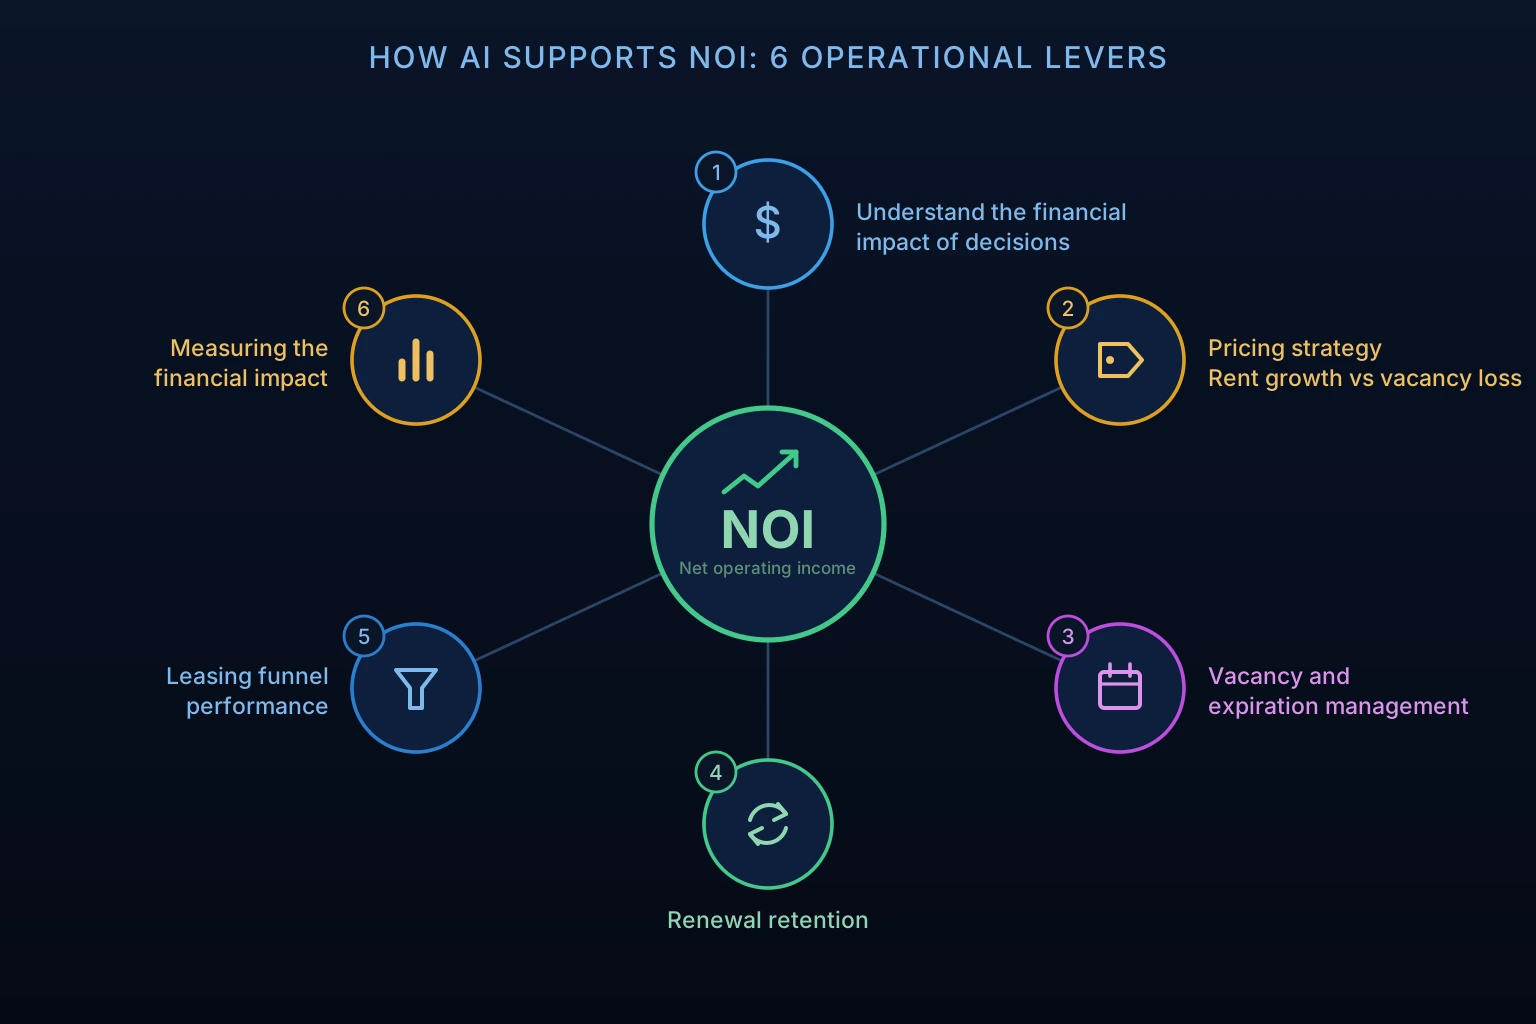
- Understand the Financial Impact of Operational Decisions
- Pricing Strategy: Balance Rent Growth Against Vacancy Loss
- Vacancy and Expiration Management
- Renewal Retention
- Leasing Funnel Performance
- Measuring the Financial Impact
1. Understand the Financial Impact of Operational Decisions
Rental revenue, vacancy loss, concessions, and turnover expenses all feed NOI, and small changes in each compound over a year.
Take a hypothetical 200-unit property with an average rent of $2,000. Each vacant day costs about $67 per unit. If 30% of units turn each year (60 turns) and average vacancy per turn falls by five days, the property avoids 300 vacant days, or roughly $20,000 in rental revenue. No single decision looks dramatic, and the total adds up.
Illustrative Financial Comparisons
Assumptions: These hypothetical comparisons use consistent 12-month measurement periods, with 30 vacant days treated as one month and a $2,000 monthly rent for vacancy calculations. The pricing example compares rental revenue collected within that period, while the renewal example includes specified turnover expenses. Actual financial results depend on lease terms, vacancy duration, operating costs, and future leasing outcomes.
These scenarios illustrate how operational decisions can affect revenue and NOI, not guaranteed financial returns. AI helps identify opportunities and inform decisions; realized financial performance depends on management execution and property conditions.
2. Pricing Strategy: Balance Rent Growth Against Vacancy Loss
A higher asking rent does not always produce higher revenue. In the first comparison, a $2,000 lease signed immediately earns $900 more over 12 months than a $2,100 lease that waits 30 days. Achieved rent and vacancy duration matter together.
AI-supported pricing analysis helps teams weigh leasing velocity, conversion, current and predicted availability, and occupancy objectives before changing a price. Recommendations should reflect internal property performance and the customer-defined asset strategy, with publicly available market data adding context.
Read Also:
- NOI in Multifamily: Examples & How to Calculate
- 9 Tenant Retention Strategies that Improve Multifamily NOI
3. Vacancy and Expiration Management
Concentrated lease expirations, particularly during slower leasing seasons, increase the risk of vacancy loss and reduced pricing flexibility. Consider a property with 30 leases expiring in December, well above its monthly exposure target. If a more balanced expiration schedule reduces average vacancy from 30 to 15 days across those units, the property could avoid 450 vacant days, representing approximately $30,000 in potential rental revenue at $2,000 per month.
Managing expiration exposure requires advance planning. Lease-term strategies implemented today may take several leasing cycles to meaningfully improve future expiration distribution. Forward-looking analytics help operators identify these risks early and evaluate renewal strategies, lease terms, and leasing priorities before concentrated exposure becomes a financial challenge.
4. Renewal Retention: The Trade-Off Between Rent Growth and Turnover
Renewal decisions affect both revenue and expenses. Research referenced by the National Apartment Association estimates that a resident non-renewal can cost approximately $4,000 when accounting for turnover expenses, marketing, and lost rental income. Actual costs vary by property and market. The hypothetical comparison above uses $1,500 in turnover expenses and calculates vacancy loss separately.
Renewal strategy requires balancing potential rent growth against retention probability, achievable replacement rents, turnover expenses, and future expiration exposure. A higher renewal offer may generate additional revenue if accepted, but the financial benefit must be weighed against the potential costs of vacancy and resident turnover.
According to CBRE's 2026 U.S. Real Estate Market Outlook, renewals represent 57% of all leasing activity, underscoring the importance of retention in overall property performance. AI-supported renewal and expiration analysis can help operators evaluate these trade-offs, while actual renewal outcomes remain dependent on resident decisions and market conditions.
5. Leasing Funnel Performance: Find Revenue Leakage Early
Weak lead-to-tour or tour-to-application conversion can extend vacancy when sufficient demand fails to translate into signed leases. Suppose a layout receives enough leads to meet its leasing target, but tour-to-application conversion is declining. Identifying and addressing barriers in follow-up, touring, or the application process may improve leasing velocity without immediately reducing rents.
As the fourth hypothetical comparison illustrates, if improved conversion reduces vacancy by 25 days across 10 units, the property could recover approximately $16,667 in rental revenue. The financial benefit depends on whether stronger conversion actually results in faster leasing.
AI-generated insights can point to the specific layouts with conversion challenges, so teams investigate follow-up, marketing, or pricing before the issue reaches occupancy and financial reporting.
6. Measure the Financial Impact of AI-Supported Decisions
To evaluate AI's financial impact, distinguish between improvements in operational performance and the resulting changes in revenue and expenses.
Track the leading indicators:
- Pricing: Changes in achieved rents and effective rental revenue
- Vacancy: Changes in vacant days, future availability, and expiration exposure
- Retention: Renewal conversion and upcoming resident turnover
- Leasing: Lead conversion, leasing velocity, and days on market
Connect those indicators to financial outcomes:
- Rental revenue: Additional income from higher achieved rents or fewer vacant days
- Vacancy and concessions: Changes in revenue loss associated with unoccupied units or leasing incentives
- Turnover expenses: Changes in make-ready, marketing, and other costs associated with resident turnover
- NOI performance: Actual operating revenue and expense results compared with budget and historical performance
For example, stronger renewal conversion is a positive operational indicator. Its contribution to NOI becomes measurable when the property experiences lower vacancy loss, reduced turnover expenses, or improved rental revenue.
Compare results against a defined baseline while accounting for market conditions, seasonality, and other contributing factors. Potential revenue opportunities are not the same as realized NOI improvement. Track both to understand whether AI-supported decisions are producing measurable financial value.
How Rentana Helps Multifamily Investors Protect and Improve NOI
Rentana connects PMS-sourced data into forward-looking analysis, helping operators identify potential revenue risks before they appear in monthly financial results.
- Lease Up Mode brings transparent pricing recommendations, forecasting, and AI insights to lease-up properties, helping teams build a data-backed plan around the property’s timeline, track progress against lease-up goals and pro forma, and adjust as conditions change
- Pricing recommendations at the bedroom or custom unit group level show their reasoning, so teams can review them against asset strategy before acting
- Predicted Occupancy connects current leasing activity, renewal trends, and future availability into a forward view of where occupancy is heading
- Exposure management provides visibility into future lease expirations and projected availability by month and layout, helping operators identify concentrated exposure and evaluate strategies to reduce seasonal vacancy risk.
- Renewal visibility tracks upcoming expirations, renewal offer status, and conversion performance, helping teams prioritize follow-up and assess potential impacts on future availability.
- Configurable asset strategy settings carry each property’s occupancy, pricing, renewal, and expiration goals
- AI-generated Property Insights show what changed, why it may matter, and where to investigate, including layout-level conversion challenges
- Ask Rentana helps investigate performance drivers through natural-language questions with charts and tables
- Target Tracking compares actual occupancy, pricing, and renewal conversion performance against configured property targets, helping asset managers evaluate results relative to their investment objectives.
Rentana's URS Capital Partners case study highlights a two-week implementation across 12 properties, an 8.2% sequential increase in NOI from Q1 to Q2 2025, and a reported 414% ROI. These results reflect the customer's reported experience and should not be interpreted as guaranteed outcomes or improvements attributable solely to AI.
Don’t Miss:
- How to Audit and Optimize Your Amenity Premiums for Higher NOI
- 9+ Ways to Improve NOI for Multifamily Properties
Conclusion: How AI Improves NOI in Real Estate
Improving NOI starts well before the results appear on a financial statement. Changes in leasing velocity, expiration exposure, renewal conversion, and achieved rents provide early signals of where revenue is being protected, or where financial performance may be at risk.
AI helps multifamily operators connect those operational indicators to their broader financial objectives, identifying opportunities to act before challenges translate into vacancy loss, unnecessary expenses, or missed revenue opportunities.
Ultimately, the value of AI is measured not by the number of insights it generates, but by the quality of the decisions those insights support and the financial outcomes that follow. Strong asset management combines forward-looking analysis with disciplined execution, turning better information into measurable NOI performance.