
Most multifamily teams already track occupancy, rent, and renewal rates. AI adds value by connecting these metrics to reveal patterns, identify emerging risks, and provide a more complete picture of property performance. Rather than evaluating each metric in isolation, AI-supported analysis helps operators understand how performance indicators influence one another and where management attention may be needed.
According to Multifamily Executive, AI adoption among property management firms rose from 17% in 2024 to 28% in 2025, a 65% year-over-year increase. As adoption grows, the useful question becomes which metrics the analysis should be built on.
This article covers seven metrics worth tracking, why they work best in combination, how lease-up changes the framework, and where human judgment stays in charge.
Related:
- Multifamily Asset Strategy: 7 Ways to Build One That Works
- 55 Key Multifamily Terms Every Operator Should Know
What Are AI Metrics for Multifamily Operators?
AI metrics are the operational performance measures that AI-supported analytics evaluates to identify trends, test relationships between signals, estimate where performance is heading, and flag where management attention is needed.
A traditional KPI reports what happened. AI-supported analysis adds why performance may be changing and what may come next. The metrics themselves are familiar. The difference is in how they are analyzed: together, at the layout level, and with forward-looking context.
Top 7 AI Metrics to Track for Multifamily Operators
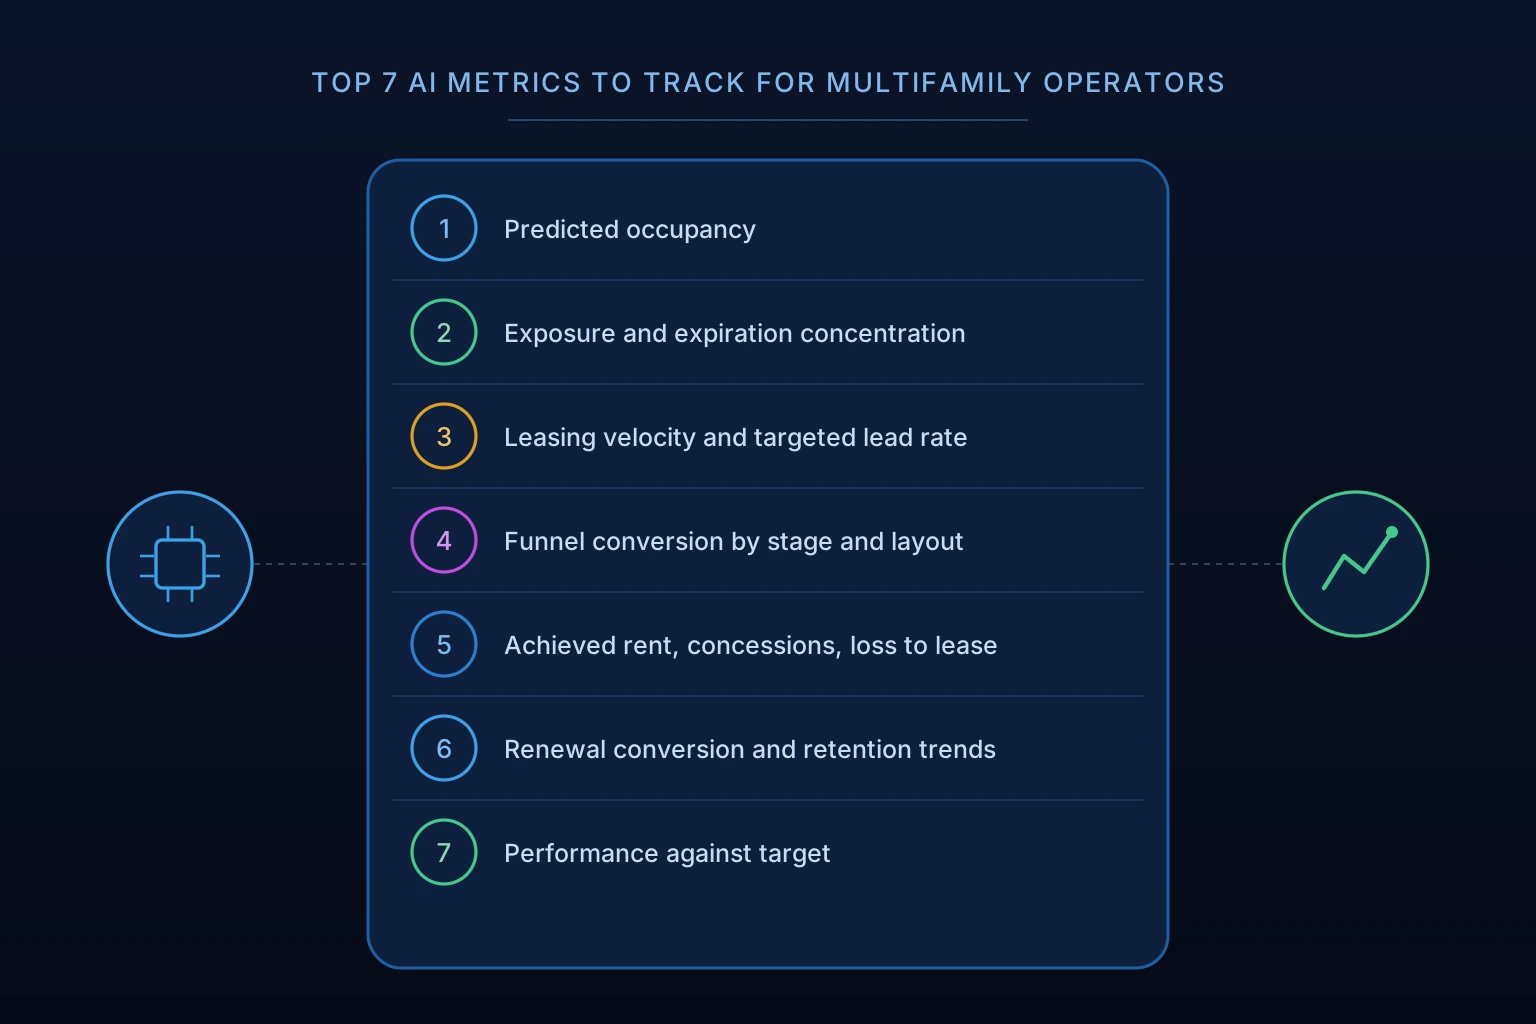
- Predicted Occupancy
- Exposure and Expiration Concentration
- Leasing Velocity and Targeted Lead Rate
- Funnel Conversion by Stage and Layout
- Achieved Rent, Concessions, and Loss to Lease
- Renewal Conversion and Retention Trends
- Performance Against Target
1. Predicted Occupancy
Current occupancy describes where a property stands today. Predicted Occupancy uses current leasing activity, expected renewals, and anticipated availability and leasing activity to estimate where occupancy is heading relative to the property's configured target.
A property sitting at 95% occupancy may be projected to decline toward 90%, providing an early indication of potential risk. While forecasts are not guaranteed outcomes, they give operators an opportunity to evaluate their strategy before the anticipated decline materializes.
2. Exposure and Expiration Concentration
Lease expiration exposure measures the concentration of upcoming lease expirations by month and layout, highlighting periods when a property may face increased turnover risk. Not every expiration results in vacancy, so expected renewals, confirmed notices, and other availability indicators help operators understand how much exposure may translate into actual available inventory.
AI-supported analytics can identify periods where expiration concentration exceeds configured targets or creates potential challenges relative to seasonal leasing demand. This allows teams to evaluate renewal priorities and future lease-term strategies before exposure becomes an occupancy concern.
3. Leasing Velocity and Targeted Lead Rate
Leasing velocity measures how quickly units are being leased, while Targeted Lead Rate provides a benchmark for the level of prospect activity needed to support the property's leasing and occupancy objectives.
Comparing actual lead volume against the targeted pace helps operators identify potential demand shortfalls before they affect occupancy. When lead generation falls below the required pace for a particular layout, teams can evaluate marketing effectiveness, pricing, and leasing activity to determine where additional attention may be needed.
4. Funnel Conversion by Stage and Layout
Lead-to-tour, tour-to-application, and application-to-lease conversion reveal where prospects drop out of the leasing process. Tracking conversion by layout is particularly important because property-wide averages can conceal problems affecting specific unit types.
For example, a layout generating sufficient leads but struggling to convert tours into applications may benefit from improvements to prospect follow-up, touring experiences, or application processes before pricing adjustments are considered. Conversely, a layout with strong conversion but insufficient lead volume may require greater attention to marketing visibility, demand generation, or pricing strategy.
AI analyzes data to help operators distinguish between these challenges so they can address the appropriate stage of the leasing funnel.
Read Also:
- Data-Driven Rent Pricing in Multifamily
- 8 Multifamily Solutions Leading Operators Are Using
5. Achieved Rent, Concessions, and Loss to Lease
Achieved rent reflects the contractual rental rate secured on a signed lease, while net effective rent accounts for the financial impact of concessions over the lease term. Loss to lease measures the difference between in-place rents and the property's market rent benchmark, helping operators evaluate potential revenue opportunities within the existing rent roll.
Together, these metrics provide a clearer understanding of pricing performance. AI-supported analytics adds value by connecting rental outcomes with leasing velocity, availability, demand, and performance across individual layouts, helping operators identify where pricing strategies may need attention.
6. Renewal Conversion and Retention Trends
Renewal conversion by layout and expiration window, tracked over rolling periods, helps operators identify changes in retention before they affect occupancy. According to CBRE's 2026 U.S. Real Estate Market Outlook, renewals represent 57% of all leasing activity, up from 51% in 2015 and 48% in 2005.
Evaluating renewal conversion alongside renewal rent increases, upcoming expiration volume, and seasonal leasing demand helps operators understand where future vacancy risk may be building. For example, declining renewal conversion in a layout with a high concentration of winter expirations may signal increased vacancy exposure during a period of softer demand.
AI-supported analysis can identify these patterns early, helping teams prioritize renewal outreach, evaluate pricing and lease-term strategies, and balance retention objectives with revenue goals.
7. Performance Against Target
Performance metrics are most meaningful when evaluated against the property's specific asset strategy. Occupancy, pricing, and renewal conversion targets establish the benchmarks for success, while lease-up properties require additional goals tied to monthly absorption and stabilization timelines.
Rentana's Target Tracking compares actual occupancy, pricing, and renewal performance against configured goals, helping operators identify where results are meeting expectations and where gaps are emerging. For example, a property may be achieving its occupancy target while renewal conversion falls below expectations, signaling potential future vacancy risk despite strong current performance.
AI-supported analysis helps teams investigate these variances and determine whether additional operational attention, pricing adjustments, or changes to the broader asset strategy may be warranted. By connecting actual results to defined objectives, operators can prioritize decisions that support long-term property performance rather than reacting to individual metrics.
Top Picks:
- Multifamily Portfolio Strategy: How to Build One That Scales
- Lease Analysis in Multifamily
Why Individual Metrics Do Not Tell the Whole Story
Reviewed alone, a metric can mislead. A property at 95% occupancy looks healthy. If renewal conversion has softened and expirations are concentrated in a slower leasing season, the same property may be projected to reach 90% within 60 days.
The occupancy figure is accurate, and the forward picture is different. AI connects current performance with forward-looking indicators, which surfaces that risk before it appears in historical reports. It also works at the property, bedroom, and pricing-group levels, since property-wide averages hide the layouts where conditions are diverging.
Leading vs. Lagging Indicators
Lagging metrics describe outcomes that are already set: achieved rents, completed leases, and historical occupancy. Leading indicators move first: lead velocity, conversion by stage, expiration concentration, and projected availability.
Consider a layout with strong lead volume and declining tour-to-application conversion. Achieved rents and occupancy may look fine for several weeks. An AI-generated insight can flag the conversion drop early, so the team reviews follow-up and the prospect experience before leasing slows, vacancy rises, or achieved rents fall.
How AI Connects Metrics to Performance Drivers
AI-supported analytics become particularly valuable when multiple performance indicators reveal patterns that may not be apparent when reviewing individual metrics. By connecting leasing activity, availability, pricing, and renewal performance, AI can help identify potential drivers of underperformance and prioritize areas for investigation.
Four common scenarios:
- Occupancy decline: Lead demand, conversion, notices, renewal performance, and future exposure together show whether the driver is demand, conversion, retention, or expirations
- Weak rent growth: Achieved rents, availability, leasing velocity, concessions, and expiration concentration help separate pricing pressure from exposure
- Uneven layout performance: Differences in leasing velocity may trace to demand, desirability, pricing, or availability
- Renewal risk: Upcoming expirations, historical retention, renewal pricing, and projected occupancy show where turnover pressure may build
AI findings should arrive with supporting data and reasoning. According to the National Multifamily Housing Council’s AI Fact Sheet, housing operators using AI platforms recognize the need for continual internal review and oversight of AI models, processes, and outcomes. Findings point to where to investigate. Pricing and operational changes stay with the team.
How AI Metrics Change During Lease-Up
Lease-up requires a different performance framework than a stabilized property. Rather than focusing primarily on occupancy targets, operators must evaluate progress against monthly leasing goals, absorption velocity, targeted lead rates, conversion by layout, and the property's stabilization timeline.
Consider a lease-up property tracking almost exactly to its overall leasing plan. A closer look reveals that studios and three-bedroom units are meeting or exceeding their individual targets, while two-bedroom units are trailing by two leases. Lead volume for the two-bedroom grouping is also below the targeted pace, suggesting that additional attention may be needed to maintain its absorption goals.
AI-supported analysis helps identify these differences and evaluate whether pricing, demand generation, or leasing execution requires attention. While measured price increases may be appropriate for layouts already meeting their targets, underperforming layouts may require a different approach.
Rentana's Lease Up Mode connects property-specific leasing plans with monthly absorption targets, forecasting, AI Insights, and pricing recommendations, helping operators manage performance by layout while staying aligned with their stabilization objectives.
Read Also:
Turning Metrics Into Insight With Property Insights and Ask Rentana
Two tools turn metrics into direction. AI-generated Property Insights proactively surface trends, risks, and opportunities across occupancy, pricing, conversion, renewals, exposure, and asset strategy, and each one explains what changed, why it may matter, and where to investigate.
Ask Rentana supports on-demand investigation in natural language, with explanations, charts, and tables. Operators can ask questions such as:
- Why is predicted occupancy declining despite strong current leasing activity?
- Which layouts have the greatest expiration exposure?
- Are we meeting our lease-up absorption targets, and what is limiting progress?
- How does renewal performance differ across properties?
Management teams interpret the findings and make the decisions.
How Rentana Uses AI Metrics to Support Multifamily Decisions
Rentana connects PMS-sourced performance data, leasing velocity, conversion, renewal trends, and exposure into forward-looking analysis organized around each property’s own strategy.
- Lease Up Mode establishes data-backed monthly leasing targets aligned with each property's pre-leasing and stabilization timeline, with AI Insights, forecasting, and pricing recommendations supporting progress against absorption goals.
- Predicted Occupancy shows where occupancy appears to be heading against configured targets
- Targeted lead rate and conversion metrics show whether demand and funnel performance support occupancy goals
- Exposure management surfaces expiration concentration by layout and month
- Pricing recommendations at the bedroom or custom unit group level show their reasoning for team review
- Target Tracking compares actual occupancy, pricing, and renewal conversion performance against configured property targets, helping operators identify where results are deviating from their strategy.
- AI-generated Property Insights analyze performance patterns proactively
- Ask Rentana answers property and portfolio questions with supporting data and visualizations
- Configurable asset strategy settings translate each property's occupancy goals, pricing parameters, renewal targets, and expiration management preferences into settings that establish performance objectives and help guide pricing recommendations alongside current operating conditions.
Conclusion on AI Metrics for Multifamily Operators
The value of multifamily performance metrics lies not simply in tracking individual results, but in understanding how those results influence one another. Changes in leasing demand, conversion, renewal performance, pricing, and future availability often provide early indications of where a property may be heading.
AI helps operators connect these signals, identify emerging risks, and prioritize opportunities for improvement before they affect occupancy and financial performance. By evaluating metrics against property-specific objectives, management teams can move beyond reactive reporting toward more proactive, strategic decision-making.
Rentana brings these metrics together through forward-looking analytics, AI-Generated Insights, and configurable asset strategies, helping multifamily operators translate performance data into informed decisions.