

A profit and loss statement is one of the most fundamental financial documents in multifamily real estate. It tells you what a property earned, what it cost to operate, and what was left over after those costs were paid. Every asset manager, property manager, and investor who owns or oversees a multifamily property needs to be able to read one, build one, and use one to make decisions.
The multifamily P&L follows a straightforward structure, but the details matter. Which line items belong and which don't, how expenses are categorized, and what the key ratios between those line items tell you about operational health are all worth understanding clearly before you rely on a P&L to evaluate a property or present results to an owner.
This guide covers what a multifamily P&L includes, how to read one, and provides a sample template with realistic figures you can use as a starting point for your own properties.
Related:
What Is a Multifamily Profit and Loss Statement?
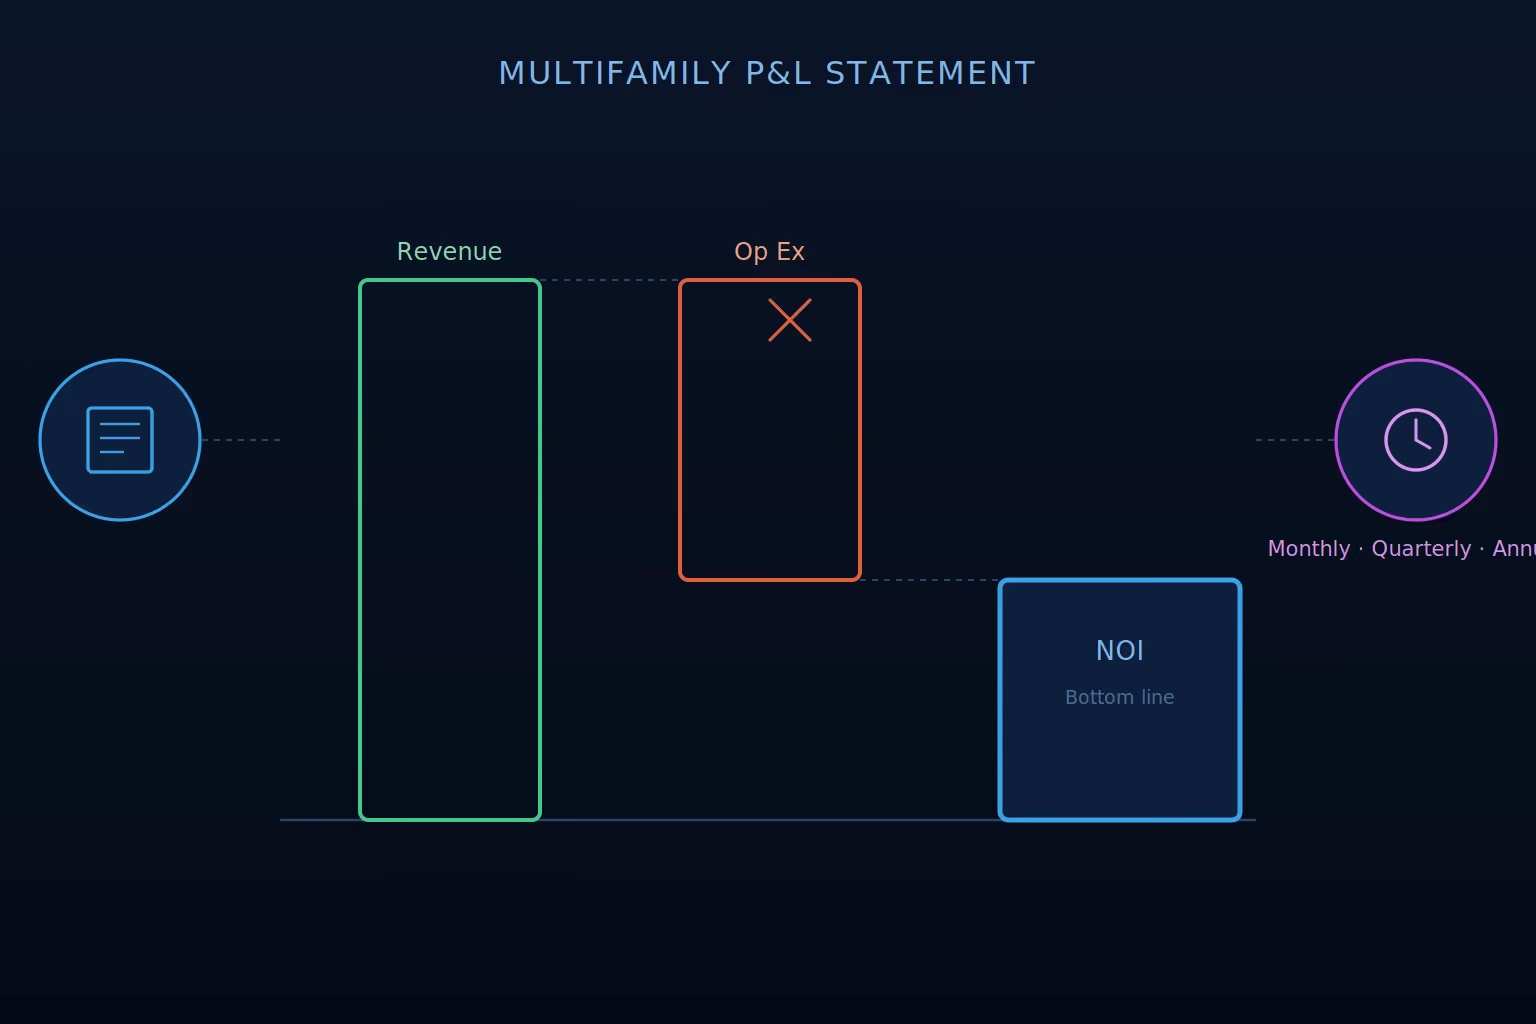
A multifamily profit and loss statement, commonly called a P&L or an operating statement, is a financial document that summarizes a property's income and operating expenses over a specific period, typically a month, a quarter, or a full year. The bottom line of a multifamily P&L is net operating income, the amount the property generates from its operations after all operating expenses have been deducted from total revenue.
A multifamily P&L is not the same as a corporate income statement. It does not include debt service, depreciation, amortization, or income taxes. Those items are deliberately excluded because the P&L is designed to measure the property's operational performance independent of how it is financed or who owns it. That financing-neutral structure is what makes NOI, the P&L's bottom line, the standard metric for valuing and comparing multifamily properties across different ownership structures and capital stacks.
The P&L is also distinct from a cash flow statement. A cash flow statement accounts for debt service, capital expenditures, and other below-the-line items to show what actually hits the owner's bank account. The P&L stops at NOI, which is why a property can show strong P&L performance while still delivering modest or negative cash flow to the owner after debt service is paid.
Understanding what a multifamily P&L includes, what it excludes, and where it sits in relation to other financial documents is the foundation for using it effectively as an operational and investment analysis tool.
What Does a Multifamily P&L Statement Include?
A multifamily P&L is organized into two main categories: revenue and operating expenses. Here's what belongs in each.
Revenue
- Gross potential rent (GPR): The total income the property would generate if every unit were occupied at full market rent for the entire period
- Vacancy loss: The income lost from unoccupied units, expressed as a deduction from GPR
- Concessions: Rent discounts or free rent periods offered to attract or retain tenants, deducted from GPR
- Credit loss: Income lost due to non-payment or bad debt, typically 1% to 2% of GPR on stabilized properties
- Net rental income: GPR minus vacancy loss, concessions, and credit loss
- Other income: All non-rental revenue the property generates including parking fees, laundry income, pet fees, storage fees, late fees, and utility reimbursements
- Effective gross income (EGI): Net rental income plus other income, representing total collectible revenue
Operating Expenses
- Property taxes: Annual tax obligation assessed by the local municipality, typically the largest single operating expense line
- Insurance: Property and liability insurance premiums covering the building and common areas
- Property management fees: Typically 4% to 8% of collected rent paid to the management company
- Repairs and maintenance: Day-to-day maintenance costs including labor and materials for routine upkeep
- Utilities: Landlord-paid utilities including water, sewer, trash, common area electricity, and gas
- Landscaping and grounds: Lawn care, snow removal, and exterior maintenance costs
- Advertising and leasing: Marketing costs including ILS fees, signage, and leasing commissions
- Administrative costs: Office supplies, accounting fees, legal fees, and other administrative expenses
- Contract services: Pest control, elevator maintenance, security, and other recurring vendor contracts
- Replacement reserves: A budgeted amount set aside for future capital expenditures, typically $200 to $400 per unit annually
What Is Deliberately Excluded
- Mortgage payments and debt service: Principal and interest payments reflect financing structure, not operational performance
- Depreciation and amortization: Non-cash accounting charges that do not represent actual operating costs
- Capital expenditures: Major one-time improvements like roof replacement or HVAC upgrades sit below the NOI line
- Income taxes: Tax obligations vary by ownership structure and are excluded to keep the P&L ownership-neutral
Read Also:
- AI-Driven Demand Generation for Multifamily: Explained
- Where to Find Multifamily Properties: 20 Platforms and Sources
Multifamily P&L Statement Sample: A Line by Line Breakdown
Below is a sample annual profit and loss statement for a stabilized 20-unit multifamily property with an average market rent of $1,500 per unit per month. Use this as a starting point and adjust the figures to reflect your property's actual performance.
MULTIFAMILY PROPERTY PROFIT AND LOSS STATEMENT SAMPLE
Property: 20-Unit Apartment Community
Period: January 1, 2026 – December 31, 2026
REVENUE
OPERATING EXPENSES
NET OPERATING INCOME
KEY PERFORMANCE METRICS
How to Use This Multifamily Profit and Loss Sample
A few notes on applying this template to your own property:
Adjust for your actual unit mix. This template uses a single average rent across all units. For properties with multiple unit types, calculate GPR separately for each unit type and sum the results as covered in the GPR section of this guide.
Use actual figures where available. The expense figures above are reasonable benchmarks but will vary significantly by market, property age, and management approach. Replace benchmark figures with your actual costs as soon as you have them.
Run it monthly and annually. A monthly P&L allows you to catch expense variances and revenue shortfalls early. An annual P&L gives you the full-year view needed for valuation, refinancing, and investor reporting.
Compare against prior periods. A P&L in isolation tells you what happened. Compared against the prior month, prior quarter, or prior year, it tells you whether performance is improving or deteriorating and where to focus operational attention.
Top Picks:
- Student Housing vs Conventional Multifamily
- How To Calculate the Value of a Multifamily Property Easily
How to Use a Multifamily P&L to Improve Property Performance
A P&L statement is most valuable not as a historical record but as a diagnostic tool. The numbers on the page tell you what happened. The analysis you apply to those numbers tells you why it happened and what to do about it. Here's how asset managers and property managers use P&L analysis to drive operational improvement.
1. Start with the Expense Ratio
The expense ratio, total operating expenses divided by effective gross income, is the single most useful efficiency metric on a multifamily P&L. It tells you what percentage of every dollar of revenue is consumed by operating costs before NOI is generated. A well-run stabilized multifamily property typically runs an expense ratio between 35% and 50% depending on property age, market, and whether utilities are included.
If your expense ratio is significantly above the benchmark for comparable properties in your market, the P&L is telling you that costs are outpacing revenue in a way that is compressing NOI and reducing property value.
The next step is to identify which specific expense lines are running above market, which requires comparing your line-by-line figures against submarket benchmarks rather than just looking at the aggregate ratio.
Common culprits for elevated expense ratios include property management fees that are above market for your property size, insurance premiums that haven't been competitively quoted in several years, maintenance costs that reflect deferred capital expenditures rather than routine upkeep, and utility expenses that could be reduced through submetering or RUBS billing.
2. Track Revenue Leakage
The revenue section of the P&L tells you not just what the property collected but how much potential income was lost and why. Vacancy loss, concessions, and credit loss are all forms of revenue leakage that reduce EGI below GPR, and each one points to a different operational problem with a different solution.
High vacancy loss relative to the submarket average points to a leasing problem: pricing, marketing, product quality, or some combination. High concessions relative to market suggest the property is using discounts to compensate for a competitive disadvantage rather than addressing the underlying issue. High credit loss points to a tenant screening or collections problem that needs to be addressed at the management level.
Tracking these three revenue leakage lines separately, rather than looking only at the aggregate economic occupancy figure, gives you the diagnostic specificity needed to identify and address the right problem rather than applying generic solutions to a poorly understood issue.
3. Use NOI Movement to Identify Value Creation and Destruction
Every dollar of NOI improvement or deterioration has a direct and calculable impact on property value through the cap rate formula. At a 5.5% cap rate, a $10,000 annual improvement in NOI adds approximately $182,000 in property value. A $25,000 annual deterioration reduces value by approximately $455,000. That direct connection between operational performance and asset value is what makes regular P&L analysis one of the highest-return activities in multifamily asset management.
Tracking NOI movement on a monthly and annual basis, comparing it against the prior period and against the original underwriting projections, keeps both property managers and owners focused on the financial outcomes that matter most. When NOI is trending in the wrong direction, the P&L is almost always the first place the signal shows up, often months before it becomes visible in an appraisal or a refinancing conversation.
4. Present P&L Results Effectively to Owners and Investors
For property managers reporting to owners, and for asset managers reporting to investors, the P&L is the primary financial communication tool. How it is presented matters as much as what it contains. A well-presented P&L report includes not just the current period figures but a comparison against the prior period, the annual budget, and the original underwriting assumptions, with a brief narrative explaining the key variances and what is being done to address them.
Owners and investors who receive clear, consistent, well-explained P&L reporting develop more confidence in the management team and are more likely to approve capital improvements, operational changes, and strategic recommendations that require their buy-in. Those who receive opaque or inconsistent reporting are more likely to question management decisions and less likely to act quickly on recommendations that require their approval.
Don’t Miss:
Conclusion on Sample Multifamily Profit and Loss Statement
A multifamily profit and loss statement is only as useful as the attention you give it. The numbers don't interpret themselves. But for operators and investors who review the P&L consistently, benchmark it against market standards, and use it to ask the right questions about revenue leakage and expense performance, it becomes one of the most powerful operational tools available.
Use the template in this guide as a starting point, replace the benchmarks with your actual figures as quickly as possible, and review it monthly. The patterns that emerge over time will tell you more about your property's performance than any single snapshot ever could.


