Multifamily rent reporting should do more than summarize what happened. For asset managers and revenue teams, the value of reporting is whether it helps explain what is changing, why it matters, and where the team should focus next.
Most operators already have access to a large amount of data. Rent rolls, occupancy reports, leasing activity, renewal reports, pricing exports, and concession summaries all exist somewhere in the operating workflow. The challenge is that those reports often live in different systems, use different definitions, or require manual assembly before the team can understand what the data is actually saying.
That creates a familiar reporting problem: too much time is spent collecting and reconciling information, and not enough time is spent evaluating performance.
Effective multifamily rent reporting solves that problem by organizing revenue, leasing, occupancy, renewal, and pricing data around the decisions asset managers and revenue teams need to make. The goal is not simply to produce more reports. The goal is to create a reporting workflow that supports better visibility, faster investigation, and more consistent revenue decisions.
What Is Multifamily Rent Reporting?
Multifamily rent reporting is the process of collecting, organizing, and reviewing financial and operational data related to rental income performance across a property or portfolio. At its most basic, it covers what was billed, what was collected, and what is outstanding.
At its most useful, it connects those revenue figures to the operational signals that explain them, leasing velocity, renewal conversion, exposure concentration, and pricing alignment, so the team understands not just what the property collected but whether that performance is sustainable and where it is heading.
The distinction matters because revenue figures are lagging by nature. They reflect decisions and conditions from weeks or months earlier.
A collections report that shows strong performance may be built on leasing momentum that has already started to slow. A rent roll that looks stable may be sitting on top of an expiration concentration that will create availability pressure in 60 days. Practical rent reporting connects the revenue picture to the operational signals that will shape it in the period ahead, not just the period that has already passed.
In a multifamily context, rent reporting typically covers gross potential rent, vacancy and concession loss, effective gross income, renewal conversion and trade-out performance, leasing velocity by unit type, exposure and forward availability, and pricing performance relative to leasing outcomes. Together these inputs give operators and asset managers a complete picture of how revenue is being generated, what is influencing it, and where it may be heading.
Related:
- 7 Multifamily Rental Market Trends so Far
- Best Rent Recommendation Tools: What Operators Should Evaluate
What Multifamily Rent Reporting Should Help Teams Understand
Rent reporting is often treated as a backward-looking exercise. A team reviews what rents were achieved, what concessions were used, which leases were executed, and how occupancy changed over a defined period.
Those questions matter, but they are only the starting point.
For revenue management, the more important question is what the reporting helps the team understand about current and future performance. A strong reporting workflow should help answer questions such as:
Are rents being achieved at the level expected? Are concessions affecting effective rent performance? Are executed leases aligning with pricing strategy? Are renewals supporting occupancy and revenue goals? Are certain layouts or properties creating performance gaps? Is the asset tracking toward its configured targets?
The strongest multifamily rent reporting connects these questions rather than forcing the team to evaluate each one in isolation.
For example, an Executed Leases report can show how achieved rents, concessions, effective rents, renewal conversion, and occupancy are affecting revenue performance. A Lease Compliance report can surface operational training needs when executed leases are not aligning with accepted pricing recommendations or configured pricing rules. A Lease Trade-Out report can help teams understand how rent movement is performing across new leases and renewals. Target Tracking reports can show whether the property is performing above or below plan across pricing, occupancy, and renewals.
Individually, each report answers a specific question. Together, they help revenue teams understand whether the asset’s leasing, pricing, occupancy, and renewal strategies are working in the same direction.
Standard Reports vs. Custom Performance Analysis
A strong reporting workflow needs both consistency and flexibility.
Standard reports are valuable because they create a shared language across teams. When leasing, revenue management, operations, and asset management all use the same definitions and report structure, performance reviews become easier to compare and easier to act on.
Rentana’s Reports section is designed around that need. It provides prebuilt reports that support day-to-day operations, performance review, and strategic analysis across leasing, pricing, occupancy, renewal, and compliance metrics. These reports use standardized definitions so teams can evaluate performance consistently across workflows and properties.
But standard reports cannot answer every question.
Some performance questions require deeper investigation. A team may want to compare leasing velocity across layouts, evaluate occupancy movement across multiple properties, investigate a change in renewal conversion, or understand whether a specific unit group is driving a broader performance trend.
That is where Metrics Browser becomes important.
Rentana’s Metrics Browser provides a more flexible environment for exploring underlying metrics, building customized views, creating charts, and tailoring analysis to specific questions or workflows. It is designed for deeper investigation, trend analysis, and ad hoc analysis when a standard report does not fully answer the question the team is trying to investigate.
The distinction matters.
Reports provide consistency for recurring revenue workflows. Metrics Browser provides flexibility for deeper performance analysis. Together, they allow teams to review the business from both standardized and custom angles without rebuilding analysis from separate exports every time.
Reporting Views That Support Multifamily Revenue Decisions
The most useful multifamily rent reports are the ones tied directly to revenue decisions.
Rather than reviewing reports as static exports, asset managers and revenue teams should evaluate whether their reporting workflow helps answer the questions that shape performance.
A strong revenue reporting process should include views that help teams understand:
- Available inventory and pricing position: What units are available, when are they available, and how are they currently priced?
- Executed leasing outcomes: What rents are being achieved, how are concessions affecting effective rent, and how are leasing outcomes trending over time?
- Pricing execution: Are approved pricing strategies being followed consistently, or are executed leases showing patterns that may require additional training, review, or process alignment?
- Rent movement and trade-out: How are new leases and renewals contributing to rent growth, effective rent performance, and overall revenue movement?
- Renewal exposure and retention: How are upcoming renewal offers, renewal decisions, and expiration patterns expected to affect occupancy and revenue?
- Performance against targets: Is the property tracking above or below plan for rent, occupancy, renewal conversion, and other configured goals?
These views do not need to exist as one single report. In many revenue workflows, they are best handled through a combination of standardized reports, portfolio rollups, and deeper analysis tools. For asset managers, portfolio visibility is especially important. A report that is useful at the property level becomes more powerful when it can also be rolled up across a portfolio, helping teams compare performance, identify outliers, and determine which assets need attention first. Dashboard views and portfolio-level summaries can help teams move from reviewing individual reports to understanding where performance is changing across the full operating footprint.
For example, Rentana supports these workflows through purpose-built reporting views for available inventory, executed leases, lease compliance, trade-out, renewal analysis, and target tracking, along with overview dashboards that surface portfolio-level performance, key metrics, and AI-generated Insights. Metrics Browser then gives teams a more flexible way to investigate specific questions, compare performance metrics across properties, and analyze trends in greater detail.
Related:
When Reports Are Not Enough: Using Metrics Browser and AI-Generated Insights
Standard reports are useful when teams know which question they need to answer. Metrics Browser is useful when the team wants to investigate a specific performance pattern in more detail. But some of the most important operating signals are the ones teams may not know to look for yet.
That is where AI-generated Insights can add another layer of value.
Rentana’s Insights surface patterns in the data that may not be obvious in a standard report or dashboard review. They are especially valuable because they can point teams toward issues that may affect performance before those issues are clearly visible in historical reporting. Instead of requiring a user to pull multiple reports, compare trends manually, and search for the driver behind a performance change, Insights summarize what may be changing, why it matters, and where the team may want to investigate further.
For example, an Insight may identify that a property appears healthy at the overall occupancy level, but a specific layout is facing upcoming expiration exposure during a lower-demand period. Another Insight may show that lead volume is adequate, but prospects are dropping off at a specific funnel stage, suggesting the issue may be conversion rather than traffic. Insights can also flag when existing specials are not being advertised or when external factors, such as severe weather, may be temporarily affecting tour activity.
The value is not that Insights replace reporting or decision-making. The value is that they help surface the right questions sooner.
Each Insight includes a high-level summary, performance impactors, topic tags such as leasing, strategy, pricing, occupancy, or specials, and supporting logic so the user can understand why the issue was surfaced. From there, the team can decide whether to review the related report, investigate further in Metrics Browser, adjust the operating plan, or monitor the signal over time.
The strongest revenue reporting workflows combine all three layers. Standard reports create consistency for recurring review. Metrics Browser supports deeper investigation when teams need to answer more specific questions. AI-generated Insights help surface patterns that may deserve attention before they show up as larger issues in historical reports.
Together, these layers help asset managers and revenue teams move from static reporting to a more active revenue management workflow.
How Rentana Supports Practical Multifamily Rent Reporting
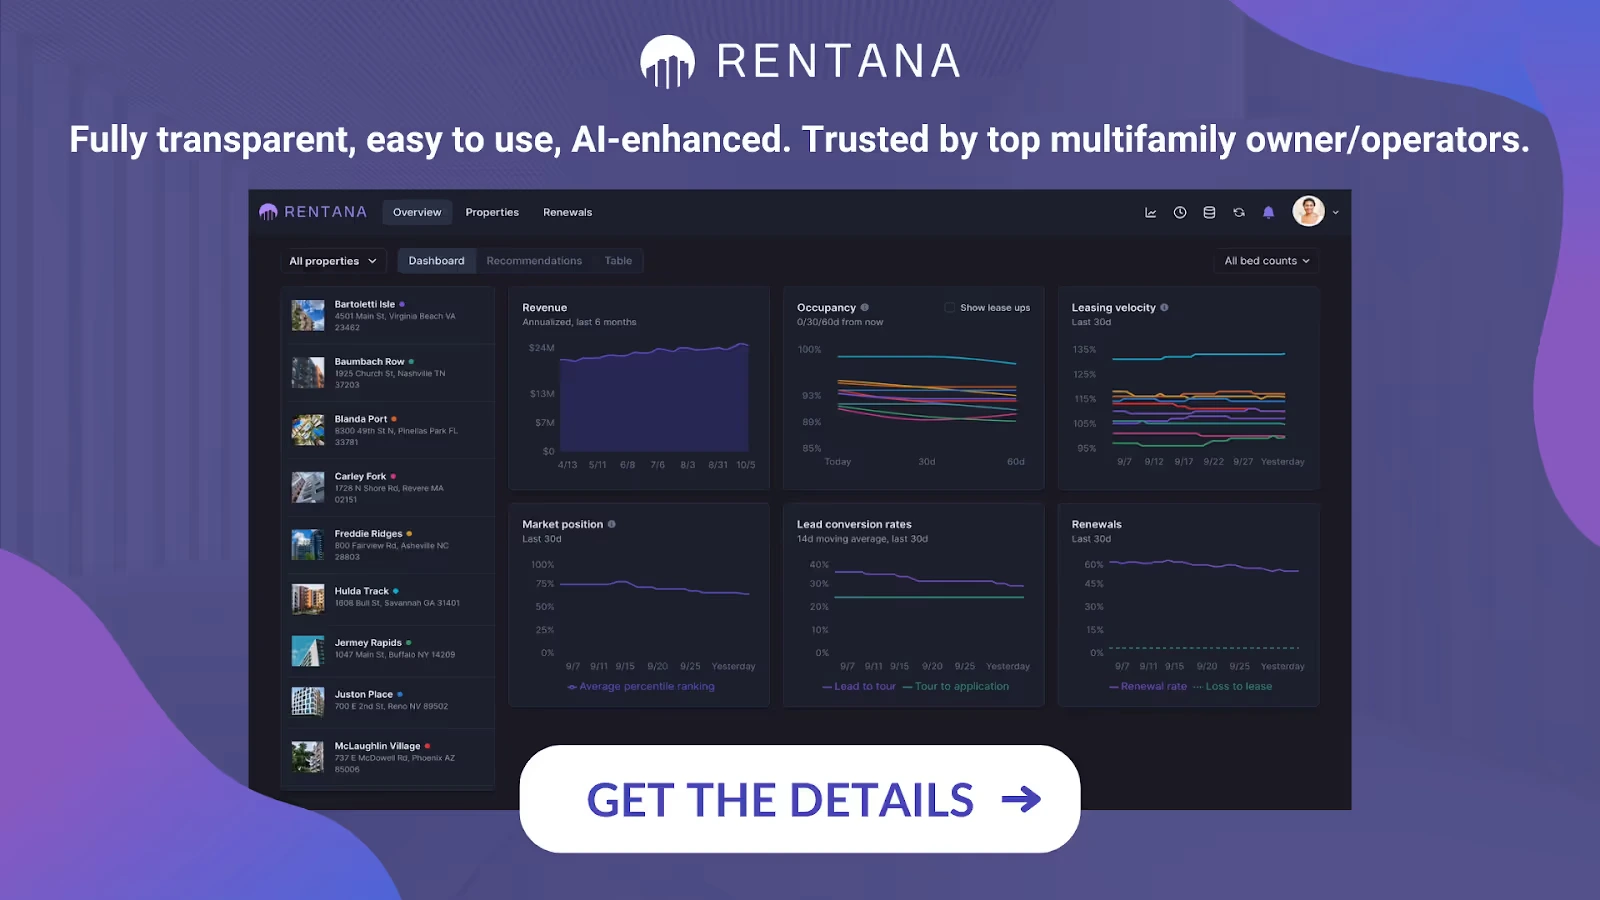
Rentana supports multifamily rent reporting by combining purpose-built reports, flexible metric exploration, and AI-generated Insights in one platform.
The Reports section gives teams standardized views into key revenue workflows, including available units, executed leases, lease compliance, lease trade-out, renewal offer analysis, and target tracking. Reports can be generated from the platform and downloaded for offline review, sharing, or further analysis.
The Metrics Browser gives teams a more flexible way to investigate performance questions that go beyond the standard report set. Rentana automatically generates more than 175 unique metrics during each data sync, covering leasing activity, pricing, occupancy, unit attributes, and competitive performance. Users can explore those metrics, build customized views, create charts, and share saved views with team members.
AI-generated Insights add another layer by helping teams identify what the data may already be showing. Instead of requiring every performance question to start with a manual report pull, Insights can surface patterns, summarize potential performance drivers, and provide the logic behind why a signal may matter.
For revenue teams and asset managers, the value is not just more access to data. It is a clearer path from data to interpretation.
Rentana helps teams review recurring reports, investigate deeper performance questions, compare performance across portfolios, and identify signals that may warrant attention before they become larger issues in historical reporting.
Don’t Miss:
- The Best Multifamily Pricing Tool for Investors
- Real-Time Data Insights For Multifamily Pricing
Conclusion on Multifamily Rent Reporting
Multifamily rent reporting is most valuable when it helps teams make better revenue decisions.
Standard reports are still essential. They create consistency, support recurring review, and give teams a shared understanding of leasing, pricing, occupancy, renewal, and compliance performance. But reporting cannot stop there.
Asset managers and revenue teams also need the ability to investigate deeper questions, compare performance across portfolios down to unit groups, and understand what is driving changes before those changes become larger performance issues.
That is why a strong reporting workflow needs more than static exports. It needs standardized reports for recurring review, flexible analysis through Metrics Browser, and AI-generated Insights that help surface patterns the team may not have known to look for yet.