
Most multifamily teams are not short on data. They have occupancy reports, leasing dashboards, renewal summaries, financial statements, market reports, lender packages, and asset management updates.
According to the National Apartment Association, as streams of data and analytics continue flowing into the multifamily housing industry, owners are evaluating performance through factors such as revenue growth, delinquency rates, leasing conversions, and profit and loss statements.
The challenge is not finding more metrics to track. It is building a workflow that helps teams understand which metrics matter, when they should be reviewed, who owns them, and what decisions they should inform.
That distinction is important. A KPI is only useful if it is connected to action. Occupancy, NOI, effective rent, leasing velocity, renewal conversion, exposure, and funnel conversion all provide value, but they do not move at the same speed or answer the same operational questions.
Some metrics explain what already happened. Others show where performance may be changing. A smaller group helps teams understand what is anticipated under current conditions. Effective KPI tracking requires knowing the difference and organizing the review process around the decisions each metric should support.
This article explains how multifamily teams can track KPIs more effectively by separating lagging metrics, leading indicators, and forward-looking signals, then connecting those metrics to review cadence, role ownership, and operational decision-making.
Related:
- Top Multifamily Management Strategies
- Multifamily Marketing Strategies that Actually Drive Leasing
What Are Multifamily KPIs?
Multifamily KPIs are the specific metrics operators use to evaluate how well a property or portfolio is performing against defined objectives.
They are not the same as all available data. A KPI is a metric that is directly connected to a decision, target, or strategic goal. When a KPI moves in a meaningful direction, it should change how the team evaluates performance or decides what to do next.
That distinction matters because multifamily teams often have access to far more data than they actively use. Occupancy, rent per unit, NOI, leasing velocity, renewal conversion, days vacant, concession usage, and funnel conversion are all metrics worth understanding. But not all of them deserve the same attention at the same frequency, and not all of them answer the same type of operational question.
Effective KPI tracking is not about monitoring everything. It is about identifying the metrics that most directly support decision-making for a specific asset, building a review cadence that matches how quickly those metrics move, and connecting the review process to action.
The Multifamily KPIs That Drive Decisions
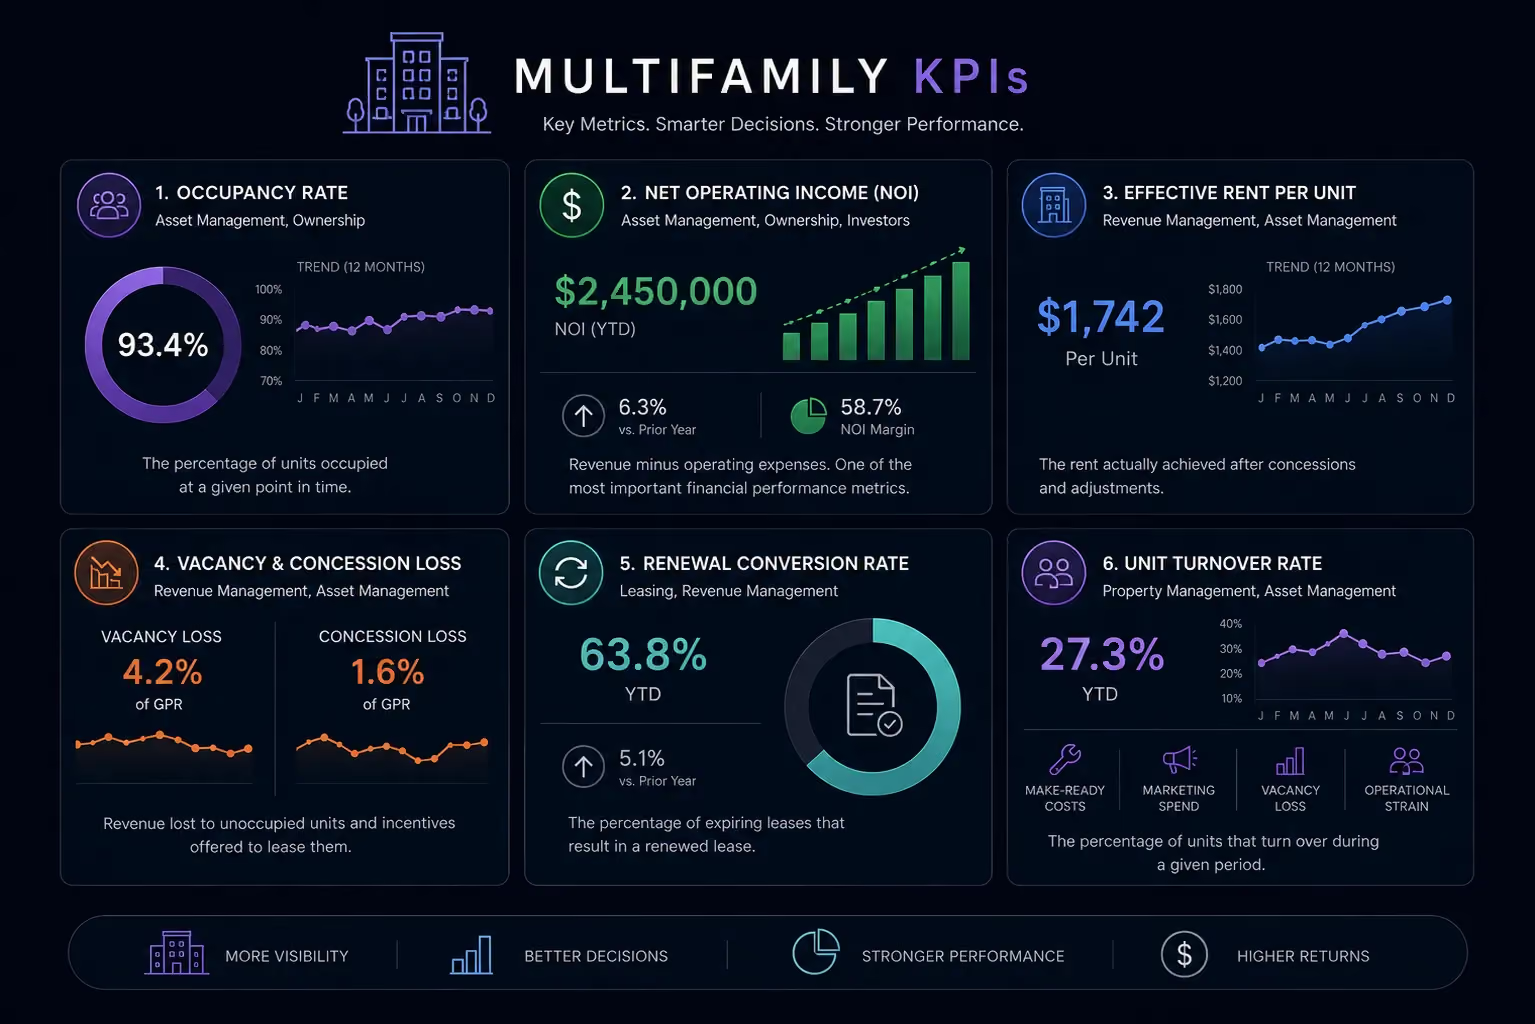
A strong KPI workflow separates metrics by the type of question they answer. Some metrics explain past performance. Others show where performance may be changing. A smaller set helps teams evaluate what is anticipated under current conditions.
Lagging Metrics: What Already Happened
Lagging metrics are still important, but they should be understood for what they are. They confirm outcomes after the fact and help teams evaluate whether prior decisions produced the intended result.
- Occupancy Rate (Asset Management, Ownership): The percentage of units occupied at a given point in time. Occupancy is a critical baseline, but it should be reviewed alongside the leading indicators that explain what is driving it.
- Net Operating Income (NOI) (Asset Management, Ownership, Investors): Revenue minus operating expenses. NOI is one of the most important financial performance metrics for owners, investors, and lenders, but it moves slowly and reflects decisions made weeks or months earlier.
- Effective Rent per Unit (Revenue Management, Asset Management): The rent actually achieved after concessions and adjustments. Effective rent is often more useful than asking rent because it reflects what the property is actually generating, not just what it is trying to charge.
- Vacancy and Concession Loss (Revenue Management, Asset Management): Revenue lost to unoccupied units and incentives offered to lease them. Increases in either metric can indicate that leasing, pricing, or demand conditions are already affecting revenue.
- Renewal Conversion Rate (Leasing, Revenue Management): The percentage of expiring leases that result in a renewed lease. Renewal conversion helps teams understand retention performance and estimate how much inventory may need to be re-leased.
- Unit Turnover Rate (Property Management, Asset Management): The percentage of units that turn over during a given period. High turnover can increase make-ready costs, marketing spend, vacancy loss, and operational strain.
Leading Indicators: Where Performance Is Heading
Leading indicators help teams understand whether performance is starting to shift before the outcome is fully visible in lagging metrics.
- Leasing Velocity (Leasing, Revenue Management): How quickly available units are leasing relative to targets and upcoming availability. A slowdown in leasing velocity can be an early signal that occupancy pressure may build if conditions do not change.
- Leasing Funnel Conversion by Stage (Leasing, Marketing): Where prospects are converting and where they are dropping off. Funnel conversion helps teams distinguish between a lead-volume issue, a tour-conversion issue, an application issue, or a closing issue.
- Renewal Conversion Trends (Leasing, Revenue Management): How renewal conversion is changing over time. A sustained decline may signal future availability pressure before it appears in occupancy.
- Days on Market by Unit Type (Revenue Management, Leasing): How long specific unit types are taking to lease once they are available for marketing. Consistent outliers within the same bedroom group can point to pricing, product positioning, or demand issues that property-level averages may hide.
- Lead Source Performance (Marketing, Leasing): Which marketing channels generate prospects who convert through the funnel. A source that produces high volume but low downstream conversion may create a marketing efficiency problem.
Forward-Looking Signals: What Is Coming
Forward-looking signals help teams evaluate future risk and opportunity before the results show up in occupancy, revenue, or vacancy loss.
- Predicted Occupancy (Asset Management, Revenue Management): A forward-looking view of what is anticipated under current conditions by connecting current leasing activity, renewal trends, and future availability.
- Exposure Concentration (Revenue Management, Asset Management): The volume of leases expiring, notices to vacate, and month-to-month leases concentrated in a specific future window. High concentration relative to the asset’s target threshold can create predictable occupancy risk if it is not visible early enough to address.
- Forward Availability by Layout (Revenue Management, Leasing): How much inventory is expected to become available in a specific unit group over the next 30 to 90+ days. This should be evaluated alongside leasing velocity to understand whether current demand is likely to absorb upcoming availability.
- Renewal Outreach Coverage (Leasing, Property Management): The percentage of upcoming expiring leases that have received renewal outreach. This process metric helps teams evaluate whether renewal efforts are happening early enough to support retention goals.
How to Build a Multifamily KPI Tracking Workflow That Works
A KPI tracking workflow is only useful if it connects metrics to decisions. These principles help turn KPI review from a reporting exercise into an operating rhythm.
1. Set Targets That Reflect Asset Strategy, Not Generic Benchmarks
A 95% occupancy target may make sense for a stabilized asset in a supply-constrained market. It may not make sense for a lease-up property still building its initial rent roll or a value-add asset mid-renovation. Every KPI in the workflow should have a target that reflects the asset’s current strategy, stage, and operating priorities. Generic benchmarks can provide context, but they should not replace asset-specific goals.
2. Match Review Cadence to How Quickly Each Metric Moves
Not every KPI needs to be reviewed on the same schedule.
Lagging financial metrics like NOI and effective rent per unit often move slowly and may be best reviewed monthly or quarterly. Leading indicators like leasing velocity, funnel conversion, and renewal conversion trends move more quickly and may require weekly attention during active leasing periods or when conditions are shifting.
Forward-looking signals like exposure concentration, forward availability, and Predicted Occupancy should be reviewed at a cadence that gives teams enough lead time to respond before risk turns into a visible occupancy or revenue issue.
3. Assign Ownership of Specific KPIs to Specific Roles
A KPI that everyone is responsible for tracking can quickly become a KPI that nobody owns. Assigning specific metrics to specific roles creates accountability. Leasing teams may own leasing velocity and funnel conversion. Marketing may own lead source performance. Revenue management may own pricing performance and renewal conversion trends. Asset management may own exposure concentration, forward availability, and portfolio-level performance.
The goal is not to create silos. It is to make sure the right person is responsible for watching the right signal and escalating it when action is needed.
4. Organize Reviews Around Decisions, Not Descriptions
The most common failure in KPI review meetings is spending the entire conversation explaining what the numbers say. A stronger review process starts from a shared, current view of performance and uses the meeting to decide what to do next. That could mean adjusting leasing focus, reviewing pricing, evaluating concessions, increasing renewal outreach, reallocating marketing spend, or escalating an asset-level concern.
The meeting should not end with everyone understanding the report. It should end with clear next steps.
5. Connect KPIs Across Functions
The most useful KPI insights often come from combinations of metrics rather than from one metric reviewed alone. Leasing velocity becomes more meaningful when reviewed alongside forward availability. Renewal conversion trends become more actionable when paired with upcoming expiration concentration. Funnel conversion becomes more useful when connected to lead source performance.
These cross-functional connections help teams move from “what changed?” to “what should we evaluate next?”
Read Also:
- The Best Multifamily Pricing Tool for Investors
- Top Uses of AI in Multifamily
How Rentana Supports Multifamily KPI Tracking
Rentana supports KPI tracking by connecting leasing, pricing, renewals, availability, exposure, and asset performance into a shared operating view.
Instead of treating KPIs as separate reports, Rentana helps teams evaluate how different signals interact. That matters because the most useful KPI insights often come from combinations of metrics: leasing velocity alongside forward availability, renewal conversion alongside exposure concentration, or funnel conversion alongside lead source performance.
1. A Shared View Across KPI Categories
Rentana brings together lagging metrics, leading indicators, and forward-looking signals so teams can review performance with more context.
Portfolio dashboards help operators and asset managers see asset performance across properties. AI-generated property insights help identify where conditions may be changing and which factors may be contributing. Predicted occupancy shows what is anticipated under current conditions by connecting current leasing activity, renewal trends, and future availability.
2. KPIs Configured Around Asset Strategy
Rentana allows teams to configure key operating assumptions at the property level, including occupancy targets, pricing guardrails, and leasing velocity expectations.
That configuration helps teams evaluate KPIs within the context of the asset’s strategy rather than against one generic benchmark. A lease-up, stabilized asset, and value-add property may each require different targets, review cadences, and operating responses.
3. Shared Visibility Across Roles
KPI ownership only works when teams are looking at the same current information.
Rentana gives leasing managers, revenue managers, operators, and asset managers shared visibility into the signals that affect performance. When leasing velocity changes, exposure builds, or Predicted Occupancy shifts, the relevant teams can evaluate the same context instead of reconciling separate reports.
4. From KPI Tracking to Operational Review
Rentana’s metrics browser supports more granular analysis across the portfolio, including views by bedroom type, custom unit group, and leasing-funnel stage.
That helps teams move from a high-level KPI to the underlying operational question. Is a performance issue concentrated in one unit group? Is the challenge lead volume, tour conversion, application conversion, or lease execution? Is upcoming exposure creating pressure in a specific availability window?
By connecting KPI tracking to those operational questions, Rentana helps teams use metrics as part of a review process rather than treating them as static reporting outputs.
Don’t Miss:
- Best Multifamily Newsletters for Operators
- How To Calculate the Value of a Multifamily Property Easily
Conclusion on Multifamily KPIs
Tracking multifamily KPIs is not the goal. Making better operational decisions is the goal.
KPIs are only useful when they are connected to the right review cadence, assigned to the right owners, and organized around the decisions they are meant to support. A metric that explains what already happened should not be reviewed the same way as a signal that helps teams evaluate what is anticipated under current conditions.
The teams that get the most value from KPI tracking are not the ones monitoring the most metrics. They are the ones that understand which metrics matter for each asset, which signals require earlier attention, and which roles are responsible for acting when performance begins to shift.
The data is already there. The opportunity is building a workflow that turns it into clearer, faster, and more consistent operational review.