How much of the data you track across your portfolio actually influences a decision?
Multifamily operators have more data than ever. Leasing reports, rent rolls, renewal logs, exposure schedules, market data. The volume is not the issue. The challenge is knowing which signals actually matter.
In fact, the real estate industry is already dealing with this gap. Research from McKinsey highlights a growing disconnect between the availability of real estate data and the ability to turn it into actionable insight. The information exists, but it is often fragmented, difficult to interpret, and not always tied to clear decisions. Too much data, not enough clarity
That challenge becomes even more pronounced in multifamily portfolios.
Leasing activity, renewal behavior, and availability are constantly changing across properties. Important signals are often buried across different reports or reviewed in isolation. By the time patterns become clear, the opportunity to act early may already be gone.
Most reports still focus on outcomes. Revenue collected, occupancy levels, variance to budget. But these numbers do not explain what is changing underneath or what is likely to happen next. The advantage today is not access to data. It is the ability to interpret signals early enough to guide what happens next.
Related:
Multifamily Property Data: Why Investors Need Better Visibility
The amount of data available to multifamily operators has increased significantly, but clarity has not kept pace.
Every property generates leasing reports, rent rolls, renewal data, exposure schedules, and market inputs. Across a portfolio, that quickly becomes a large volume of information. The challenge is not collecting it. It is understanding what it actually means.
Part of the difficulty comes from portfolio complexity.
Operators are not managing a single asset. They are managing multiple properties, across different submarkets, with different unit mixes and demand patterns. A shift in leasing at one property may not matter on its own, but when similar patterns appear across assets, it becomes a signal. Without a clear way to see those connections, important trends are easy to miss.
Another issue is timing.
Most data is reviewed after performance has already changed. Revenue reports, occupancy updates, and budget comparisons show results, but they do not always highlight what is developing underneath. Leasing momentum may be slowing. Renewal behavior may be shifting. Exposure may be building in specific months.
These are the signals that shape future performance. Without forward-looking visibility, operators are forced to react to outcomes instead of shaping them.
Related:
- The Best AI Tools for Real Estate Investors
- How AI Real Estate Assistants Help Multifamily Operators
Not All Data Is Equal: Operational vs Actionable Data
Most multifamily portfolios are already rich in data. Availability is not the issue. Relevance is.
Operational data is what most systems are built to produce. Reports that show what happened. Rent collected, occupancy levels, leasing activity, variance to budget. These are necessary, but they are backward-looking. They confirm outcomes without always explaining them.
Actionable data works differently.
It focuses on signals. What is changing? What may require attention next? Instead of asking “What happened?” It helps answer “What should we do now?”
For example, a rent report might show stable revenue. But actionable data would highlight that leasing velocity is slowing on specific unit types, or that a large number of leases are set to expire in the same period. These are early indicators, not outcomes.
This is where interpretation becomes more important than tracking.
Having more reports does not improve decision-making if the underlying signals are not connected. Operators need to understand how leasing activity, renewals, pricing, and exposure interact across the portfolio. When these signals are connected, data becomes a decision framework rather than a collection of reports.
Read Also:
- The Best Rental Pricing Software for Multifamily
- 7 Ways to Manage a Multifamily Portfolio Smarter
5 Key Multifamily Property Data Metrics Investors Should Actually Track

1. Leasing Performance (Velocity, Conversions)
Leasing performance shows how quickly demand is translating into signed leases. Leasing velocity reflects how fast units are moving, while conversion metrics indicate how effectively interest is progressing through the leasing funnel. Together, these signals help diagnose whether demand is strong, whether pricing is aligned, or whether friction exists within the leasing process. This is not just a performance metric. It is an early indicator of whether current pricing and positioning are supporting leasing outcomes.
2. Renewal Performance (Conversion, Trade-Outs)
Renewals determine how much of your revenue base is retained. Conversion rates indicate stability, while trade-outs show how new lease terms compare to previous ones. This signal directly impacts future availability and revenue continuity. Strong renewal performance reduces future leasing pressure, while declining renewals increase exposure. When evaluated alongside pricing strategy, renewal data helps ensure retention decisions align with asset-level goals and occupancy targets.
3. Exposure Risk (Lease Expirations, Predicted Availability)
Exposure is about timing. Lease expirations show when units will return to the market, while predicted availability shows how that supply will build over time. This is one of the most important forward-looking signals in the portfolio. It determines where and when leasing pressure will emerge. Exposure data allows operators to act early by adjusting renewal, pricing, lease term, marketing and operational strategies before availability spikes.
4. Pricing Performance (Relative to Demand and Leasing Outcomes)
Pricing performance is not just about rent levels or comp positioning. It is about how pricing is performing relative to demand, leasing velocity and availability conditions. Strong demand with slow conversion may indicate pricing friction. Slow leasing with rising availability may indicate misalignment with market conditions or asset strategy. This signal helps operators understand whether pricing is supporting leasing momentum or constraining it.
5. Portfolio Trends (Cross-Property Comparisons)
Individual property performance only tells part of the story. Portfolio-level trends show how assets compare to one another. Differences in leasing, pricing, or exposure often reveal where strategy is working and where it needs attention. These comparisons are critical for identifying outliers, standardizing strategy, and prioritizing decisions across assets.
Related:
How Investors Turn Multifamily Property Data Into Decisions
The challenge is not identifying these signals individually. It is understanding where to focus first, what is driving performance, and which actions will have the greatest impact across the portfolio.
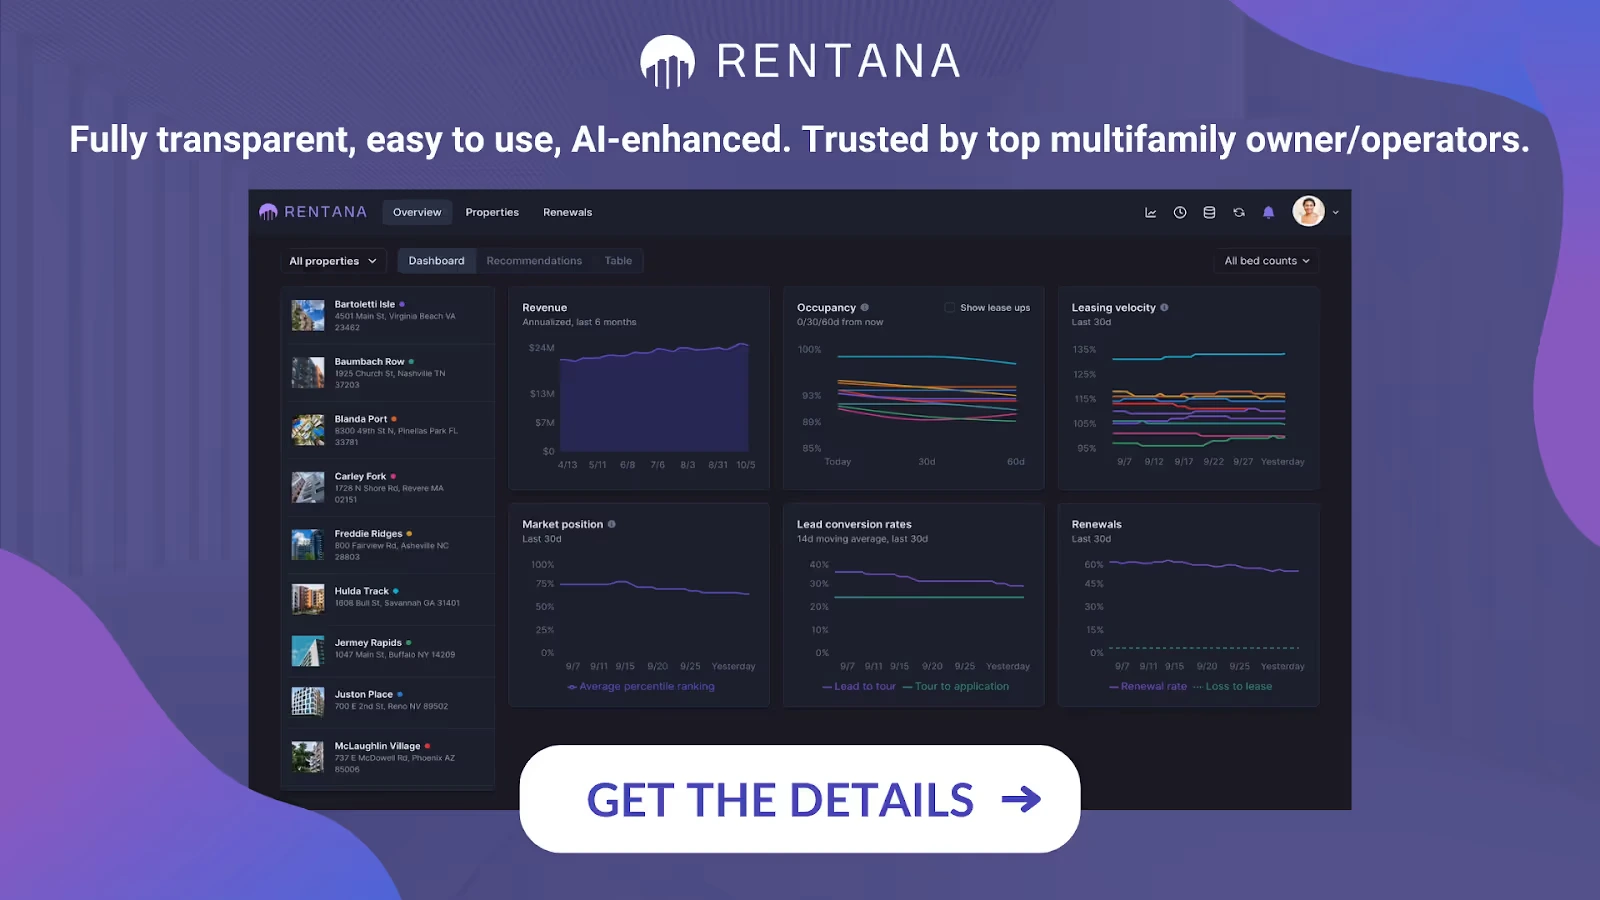
1. Portfolio Dashboard: Identify Where Attention is Needed
When managing multiple assets, the first step is knowing where to look. Rentana’s portfolio dashboard provides an immediate view of performance across properties, using clear visual indicators aligned to asset-level targets.
Assets are flagged based on performance relative to expectations, allowing operators to quickly identify which properties are on track and which are beginning to diverge. This eliminates the need to review every property individually. Instead, asset managers can immediately focus on the subset of assets where performance is changing.
Related: How Real Estate Uses Data Analytics for Portfolio-Level Investing
2. AI-Generated Insights: Understand What Is Driving Performance
Once a property is identified, the next step is understanding why performance is changing. Rentana’s AI-generated insights provide a structured summary of what is happening at the asset level. Instead of reviewing multiple reports, operators receive a clear breakdown of:
- The key drivers impacting performance
- What has recently changed
- Where risk or opportunity is developing
- Recommended actions to consider
These insights connect multiple signals such as leasing velocity, demand levels, conversion patterns, and exposure into a single explanation, allowing operators to quickly understand root causes rather than piecing together individual metrics.
This significantly reduced the time required to move from observation to understanding.
3. Predicted Occupancy and Exposure: Understand What Happens Next
After identifying the drivers, the next step is evaluating future impact. Rentana provides predicted occupancy and exposure forecasting based on current leases, renewal behavior, leasing trends, and historical context.
This allows operators to see how today’s conditions are likely to translate into future availability and leasing pressure.
If availability is expected to increase, action can be taken early. If occupancy is projected to outperform targets, operators can push revenue by adjusting pricing with confidence, knowing demand is supporting stronger performance.
If conditions are stable, operators can avoid unnecessary changes and maintain strategy.
4. Market Context and Pricing Signals: Validate Positioning
With future exposure understood, operators then evaluate how the asset is positioned relative to demand and market conditions. Rentana incorporates publicly available market data alongside internal performance signals. This allows operators to determine whether pricing is aligned with current demand or whether adjustments are needed based on shifting market dynamics. Importantly, pricing is not evaluated in isolation, but in the context of leasing performance and future availability.
5. Leasing Performance: Evaluate Demand and Conversion Signals
Next, operators evaluate leasing performance in more detail. Leasing velocity and conversion metrics provide insight into how demand is behaving at the property. Strong demand with weak conversion may indicate pricing or positioning friction.
Weak demand may indicate broader market or asset-level challenges. This step helps distinguish whether pricing is the appropriate lever or whether operational factors are contributing to performance changes.
6. Layout Performance and Pricing Decisions
Finally, operators apply this analysis and the floorplan or unit grouping levels. Rentana allows operators to evaluate layout performance across properties and identify where demand is strongest or weakest.
Pricing recommendations are generated by incorporating all of these signals, including leasing velocity, predicted availability, renewal behaviour, exposure risk, and marketing conditions while remaining aligned with asset-level strategy and targets.
Each recommendation is paired with a clear explanation of the specific drivers behind the suggested change, allowing operators to understand exactly what signals are influencing pricing and why the adjustment is being made.
This ensures pricing decisions are not reactive or based on a single metrics, but reflect how demand and supply are evolving across the portfolio with full transparency into the decision process.
Read Also:
- How to Improve Leasing Speed in Multifamily
- Lease Management Software for Real Estate: 7 Use Cases & Tools
How 29th Street Capital Uses Rentana to Track and Act on Property Data
When 29th Street Capital set out to evaluate revenue management platforms across its 12,000+ unit portfolio, the goal was not just better pricing. It was better visibility into how the signals driving performance across their properties.
Over a 90-day pilot, Rentana gave the team a clearer way to track and interpret the signals that drive performance across assets.
Instead of working across fragmented reports, 29SC was able to view leasing activity, pricing trends, and availability patterns in one place. Portfolio dashboards made it easier to compare properties, identify where performance was diverging, and focus attention where it mattered most.
Properties that began to drift from expectations surfaced immediately, allowing the team to prioritize where to investigate rather than manually reviewing each asset.
Leasing velocity and renewal behavior were viewed together as interconnected signals. This allowed the team to see how demand was shifting in real time and how renewal decisions were shaping future availability. When performance began to change, the drivers behind those shifts were visible early.
Exposure was another key factor. With lease expiration visualization and predicted availability insights, 29SC could see where supply was building before it hit the market. This made it possible to adjust strategy ahead of time rather than reacting after vacancies increased.
Floorplan-level insights added another layer. By understanding which unit types were driving leasing momentum and which were lagging, the team could refine pricing decisions with more precision across properties.
What made the difference was how quickly signals could be interpreted and translated into action.
Rentana’s AI-generated insights helped summarize what was happening across the portfolio and why. Instead of manually connecting multiple data points, the team could quickly understand:
- The key drivers impacting performance
- Where demand was strengthening or weakening
- Where exposure risk was building
- What actions to consider next. where performance was improving, where risks were building, and what actions to consider next.
This allowed the team to move from identifying performance changes to making informed decisions much faster.
Across the pilot, Rentana helped drive $4.6 million in incremental property value and 3.5% stronger net rental income performance, outperforming the competing system. Just as importantly, it enabled faster, more confident decision-making by connecting signals, surfacing drivers, and guiding action across the portfolio.
Conclusion on Multifamily Property Data
The challenge for multifamily operators is no longer access to data. It is knowing which signals to trust and how to act on them.
Leasing activity, renewal behavior, pricing performance, and exposure risk are all constantly shaping how a portfolio performs. When these signals are buried across reports or viewed in isolation, they are difficult to interpret and even harder to act on in time.
The goal is not to track more data, but to focus on the signals that directly influence revenue, occupancy, and exposure, and to understand how those signals interact. It also requires a shift from reviewing performance to interpreting change and acting before outcomes are impacted.
Platforms like Rentana are built around this shift.
By bringing together leasing, pricing, renewals, and availability into a single system,, and pairing those signals with insights that explain the drivers behind performance, operators can move from reacting to results to actively shaping them. Because in modern multifamily operations, advantage comes from identifying change early, understanding what is driving it, and applying the right decision before performance begins to shift.