Property analytics is one of those terms that gets used broadly enough to mean almost anything. A monthly occupancy report is sometimes called analytics. A portfolio dashboard that shows every metric with equal weight is sometimes called analytics. A leasing summary emailed to ownership every quarter is sometimes called analytics.
What distinguishes genuine property analytics from reporting is the organizing principle. Reporting describes what happened. Property analytics is organized around what is changing, why it may matter, and where there may be areas of opportunity to better align performance with asset goals and strategy.
What Is Property Analytics?
Property analytics is the process of collecting, connecting, and analyzing property performance data to understand what is happening at an asset, identify where conditions are changing, and support better operational and investment decisions.
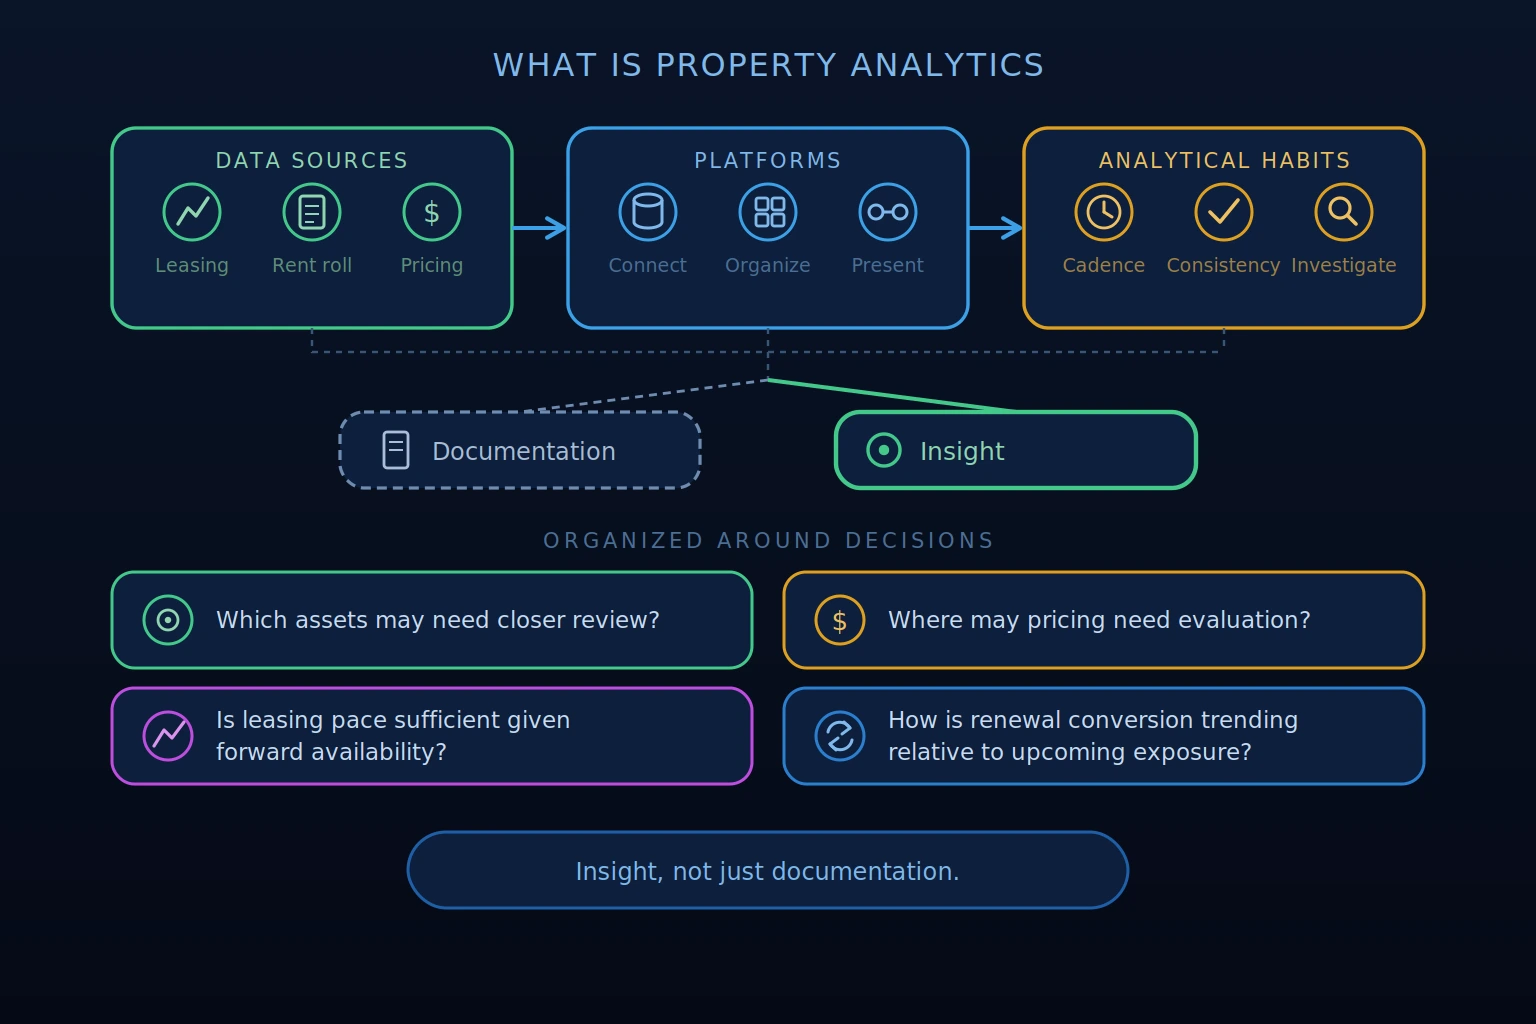
It encompasses the data sources feeding the analysis, the platforms that organize and present that data, and the analytical habits that determine whether the output produces insight rather than documentation. A property management team with strong analytics capability knows where performance is shifting before it reaches financial reporting, can compare conditions across properties using consistent methodology, and has the infrastructure to investigate specific performance questions without building a custom report from scratch each time.
The most important characteristic of useful property analytics is that it is organized around decisions. Which assets may need closer review. Where pricing may need evaluation. Whether current leasing pace is sufficient given forward availability. How renewal conversion is trending relative to upcoming exposure. Where performance may be creating opportunities to better align with asset strategy. These are questions that property analytics should answer consistently, not questions that require the team to build the analytical picture before any answer is possible.
Related:
- Property Management Public Data Analytics: A Guide for PMs
- AI-Driven Property Analytics in Real Estate
The Data Property Analytics Should Include
The data categories that matter most for meaningful property analytics are primarily internal, drawn from the PMS and connected operational systems rather than from external market benchmarks alone:
- Occupancy and availability: Physical occupancy by layout alongside what is available and expected to become available
- Leasing velocity: Absorption pace by layout relative to forward availability and occupancy targets, not only as a standalone volume number
- Funnel conversion: Where in the leasing pipeline prospects are advancing and where they are dropping off, by stage and by layout
- Pricing performance: Asking rent versus effective rent by layout, concession activity, and how pricing movement relates to leasing velocity
- Renewal trends: Conversion rates by layout and expiration window over rolling periods, trade-out between expiring and renewed lease rates
- Lease expirations and exposure: The forward distribution of upcoming availability by layout and time window
- Effective rent and loss to lease: What units are actually collecting after concessions versus gross potential rent, by layout
- Target tracking: How current performance compares against occupancy and revenue goals by property
- Public market context: Publicly advertised asking rents, concessions, and specials as external calibration alongside internal performance signals
Property-Level vs. Portfolio-Level Analytics
Property analytics operates at two levels simultaneously, and the decisions each level supports are different enough that neither can substitute for the other.
Property-level analytics supports daily and weekly operational decisions at the asset level. Which layouts are absorbing below pace. Where renewal conversion is softening in a specific expiration window. What the forward exposure picture shows for the next 60 days. These are questions that require layout-level granularity and current operational data rather than property-level averages that smooth out the differences that matter most.
Portfolio-level analytics supports prioritization and comparison across multiple assets. Which properties are drifting from performance targets. Where multiple conditions are shifting simultaneously at the same asset.
How properties compare against each other and against their own configured goals. The output at the portfolio level is a prioritized view of where attention is most needed, not a comprehensive description of every asset’s condition.
The movement between these two levels, from a portfolio signal to a property-level investigation to a layout-level finding, is where property analytics produces its most direct operational value. When that movement requires building a separate report or switching platforms, the analytical process takes longer and insights arrive later than they could.
How Property Analytics Supports Pricing Decisions
Pricing decisions in multifamily are most reliable when they are grounded in the property’s own operational data and evaluated alongside relevant public market context. Property analytics does not replace pricing judgment. It gives revenue managers a more complete view of the conditions pricing needs to respond to.
The most useful pricing analysis connects leasing velocity by layout, forward availability, occupancy goals, renewal trends, and public market context. That connected view helps teams evaluate whether current pricing is supporting the absorption pace the property needs, whether exposure is building in a way that may require closer review, and whether renewal outcomes are likely to affect future availability.
Read Also:
- AI-Powered Rental Property Pricing: How It Works
- How Do Property Owners Identify Underpriced Units in a Rental Portfolio?
How to Use Property Analytics in Practice
Property analytics is most valuable when it is organized around a consistent operational rhythm rather than used as an occasional investigative tool. The practical habits that make analytics useful:
Review on a consistent cadence. Weekly review of leasing velocity, renewal conversion trends, and forward exposure conditions surfaces changes as they develop. Monthly review of target tracking, loss to lease, and trade-out performance connects operational signals to revenue outcomes. Quarterly review of portfolio-level comparison and asset strategy alignment connects short-term performance to longer-term investment goals.
Move from portfolio signals to property and layout detail. When a portfolio-level dashboard surfaces a property that needs attention, the next step is moving to property-level analytics to understand what is driving the signal, and from there to the layout level to identify which specific configurations are contributing. That path from signal to specificity is what makes the analytical output actionable rather than directional.
Connect external context to internal performance. Public market data provides the external frame. Internal performance data answers how the specific property is performing within that frame. Using both together is what allows teams to distinguish a property-specific condition from a market-wide one, which determines what kind of response is appropriate.
Organize the review around three questions. What changed since the last review? Why may it matter given current operational conditions and asset strategy? Where are there areas of opportunity to better align performance with asset strategy? Every analytical review that ends at the data without reaching those three questions has done the reporting work without doing the analytical work.
What to Look for in a Property Analytics Platform
The evaluation criteria that matter most when choosing a property analytics platform:
- PMS integration: Direct connection to the PMS so data is current before any analysis begins, not assembled from periodic manual exports
- Forward-looking occupancy visibility: Predicted Occupancy or equivalent signal showing where occupancy appears to be heading under current conditions
- Portfolio and property-level views: The ability to move between portfolio-wide prioritization and property and layout-level detail within the same platform
- Pricing and renewal context: Pricing recommendations with reasoning attached and renewal conversion tracking connected to forward exposure conditions
- Exposure management: Lease expiration concentration surfaced by layout and time window, with a forward-looking view of availability
- Target tracking: Performance evaluated against property goals rather than only against prior period actuals
- AI-generated insights: Plain-language summaries of what is changing, why it may matter, and where further evaluation is needed
- Scheduled reporting: Recurring report delivery configured once and delivered automatically to the right audiences
- Shared team visibility: A shared operational view that gives leasing, revenue management, and asset management teams access to the same current data simultaneously
Top Picks:
- Portfolio Performance Solutions for Asset and Property Managers
- Best Rental Property Software for Landlords
How Rentana Supports Property Analytics
Rentana connects PMS-sourced operational data into a forward-looking property analytics view organized around what is changing, why it may matter, and where there may be areas of opportunity to better align performance with asset strategy.
Predicted Occupancy connects current leasing activity, renewal trends, and future availability into a forward view of where occupancy is heading at each asset, supporting earlier evaluation of whether current strategy is tracking toward property goals.
Lease Up Model supports lease-up properties with data-backed planning, forecasting, AI insights, and pricing recommendations aligned to the property’s path to stabilization, while helping teams keep future occupancy risk in view as leases are signed.
Pricing recommendations by layout connect leasing performance, forward availability, publicly available market context, and asset strategy alignment into a supported pricing evaluation with reasoning attached.
Exposure forecasting surfaces where lease expiration concentration is building by layout and time window, helping teams evaluate forward availability before overexposure creates occupancy pressure.
Renewal visibility helps teams evaluate retention trends by layout, renewal pricing in the context of current leasing conditions, and where renewal strategy may need adjustment given forward exposure and occupancy goals.
Target Tracking evaluates current performance against configured occupancy and revenue targets by property, giving asset managers and ownership groups a consistent view of where each asset stands relative to plan.
AI-generated Insights surface what is changing at specific assets, explain why it may matter given current operational conditions, and identify areas of opportunity to better align performance with asset strategy.
Portfolio dashboards give asset managers a shared, color-coded view of performance across every property simultaneously, surfacing where multiple conditions are shifting without sequential manual review.
Scheduled reporting allows recurring report delivery to be configured once and delivered automatically, keeping every team consistently informed on the cadence their role requires.
Don’t Miss:
- How to Do a SWOT Analysis For Property Management
- The Role of Business Intelligence in Property Management
Conclusion on Property Analytics
Property analytics is most valuable when it is organized around decisions rather than descriptions, reviewed on a consistent cadence rather than when someone has time to investigate, and connected across the portfolio and property levels so signals surface early enough to act on.
The data is already in most PMS systems. What determines whether it produces useful analytical output is whether it is connected, current, organized around the right questions, and reviewed consistently enough that conditions surface while there is still time to change outcomes.
Use Rentana to turn property data into forward-looking analytics that support pricing, occupancy, renewals, exposure, and portfolio performance decisions.