Spreadsheets are flexible, familiar, and genuinely useful for a wide range of tasks that multifamily operators deal with every day. One-off acquisition analysis. Budget modeling for a new asset. Variance tracking against a prior year. Ad hoc reporting for an ownership presentation. These are all tasks where a well-built spreadsheet is the right tool, and no connected analytics platform is going to replace them for that kind of work.
Most experienced operators already know this. They also know, from running into it repeatedly, that spreadsheets start to create real problems when the work shifts from one-off analysis to ongoing operational management across a portfolio. Not because spreadsheets are ineffective, but because portfolio operations now require a level of speed, coordination, and forward visibility that spreadsheets were never designed to support.
According to the National Apartment Association's Income/Expense IQ report, the market has fully entered a cost-efficiency phase where financial performance is shaped less by rent growth and more by cost structure, pricing strategy, and how efficiently properties are being run. In that environment, operational responsiveness matters more than ever.
The difference increasingly comes down to how quickly teams can identify changing conditions, align around the same signals, and respond before performance starts to move. This article is not an argument against spreadsheets.
It is an assessment of where they work well, where they become difficult to scale operationally, and what connected portfolio management looks like for teams that need faster, more coordinated decision-making across assets.
Related:
Where Multifamily Analysis Spreadsheets Start to Create Problems as Portfolio Complexity Grows
The operational limitations of spreadsheets in multifamily operations are not theoretical. They show up in recurring ways that most operators have already experienced firsthand as portfolios grow and reporting requirements become more complex. The question is not whether these limitations exist but whether the operational cost of working around them is still worth the flexibility that spreadsheets provide.
At a certain scale, it becomes increasingly difficult to manage performance efficiently through disconnected reporting workflows alone.
1. Manual Data Entry Creates Errors that Compound Over Time
Every time someone manually transfers data from a PMS report into a spreadsheet, there is an opportunity for error. A transposed number. A formula that was not updated when a new property was added. A cell reference that broke when someone reorganized the layout. Individually, these are small mistakes.
Across a portfolio of ten or fifteen assets, reviewed weekly by multiple people, they accumulate into a data reliability issue that teams often spend additional time validating and reconciling before decisions can be made confidently.
The larger issue with a multifamily analysis spreadsheet is not just accuracy. It is operational Capacity. When teams spend hours each week exporting reports, cleaning data, and maintaining spreadsheet infrastructure, that is time being spent preparing information instead of interpreting performance and responding to changes across the portfolio.
2. Spreadsheets Capture What has Already Happened
A spreadsheet shows you last month's occupancy, last quarter's variance, last week's leasing activity. All of that is useful context. What it does not provide is a connected view of where performance is heading next. Spreadsheets are fundamentally built around historical reporting. They do not naturally surface shifts in leasing velocity, changes in renewal behavior, or where future availability is beginning to concentrate across layouts and assets.
They primarily document what has already occurred rather than helping teams respond to what is developing.
For operators managing portfolios where conditions can shift quickly, that delay reduces the time available to respond before occupancy, pricing performance, or leasing pace begin to move materially.
3. Collaboration Across Teams Create Version Control Problems
A multifamily analysis spreadsheet is only a reliable source of truth when everyone is working from the save version at the same time. As portfolios grow and reporting becomes more collaborative, that consistency becomes difficult to maintain. Leasing teams, regional managers, asset management, and ownership often end up reviewing slightly different snapshots of the same portfolio, updated on different schedules and pulled from different reporting workflows.
The issue is not just version control itself. The operational misalignment that follows. Teams spend time reconciling numbers and validating assumptions before they can move into discussions around pricing, leasing strategy, or portfolio performance.
Read Also:
- Multifamily Asset Performance: Complete Guide
- Multifamily Market Trends Every Investor Should Know
4. Building and Maintaining Complex Models Takes time Away from Decisions
A sophisticated multifamily analysis spreadsheet for a growing portfolio requires substantial ongoing maintenance. Every portfolio change, reporting adjustment, or new asset adds additional complexity to the model itself.
Over time, institutional knowledge becomes embedded inside formulas, custom tabs, and reporting structures that may only be fully understood by the people who built them. As reporting requirements evolve, spreadsheets often need to be continuously rebuilt, expanded, or restructured to keep pace with operational needs.
The result is that operational teams spend increasing amounts of time maintaining reporting infrastructure rather than evaluating performance and guiding decisions.
For teams managing larger portfolios in faster-moving market conditions, that maintenance burden becomes increasingly difficult to scale efficiently.
5. Spreadsheets Require the User to Find Every Problem Themselves
The most significant limitation is often not the reporting itself, but the reliance on manual interpretation.
Spreadsheets generally require the user to identify issues manually. A slowdown in leasing velocity, softening renewal conversion, or growing exposure concentration does not naturally surface unless someone happens to review the right data at the right time and connect the pattern themselves.
The process depends heavily on consistent manual review across multiple reports, metrics, and timeframes. At the portfolio level, that becomes increasingly difficult as the number of properties, layouts, reports, and operational signals expands.
The issue is not lack of attention. It is that the operational volume across a real portfolio makes it difficult for disconnected reporting workflows to consistently surface what matters most.
According to McKinsey’s "Getting Ahead of the Market: How Big Data Is Transforming Real Estate," by the time an investor can collect, compile, and process the data needed to distill action, the best opportunities are gone. The same principle applies operationally. By the time a signal becomes obvious in a reporting workflow, the response window may already be narrowing.
Related:
- AI Adoption in Multifamily: Why it's Accelerating So Fast
- Rent Reporting in Multifamily Real Estate: A Guide
Rentana as a Connected Alternative for Multifamily Operators
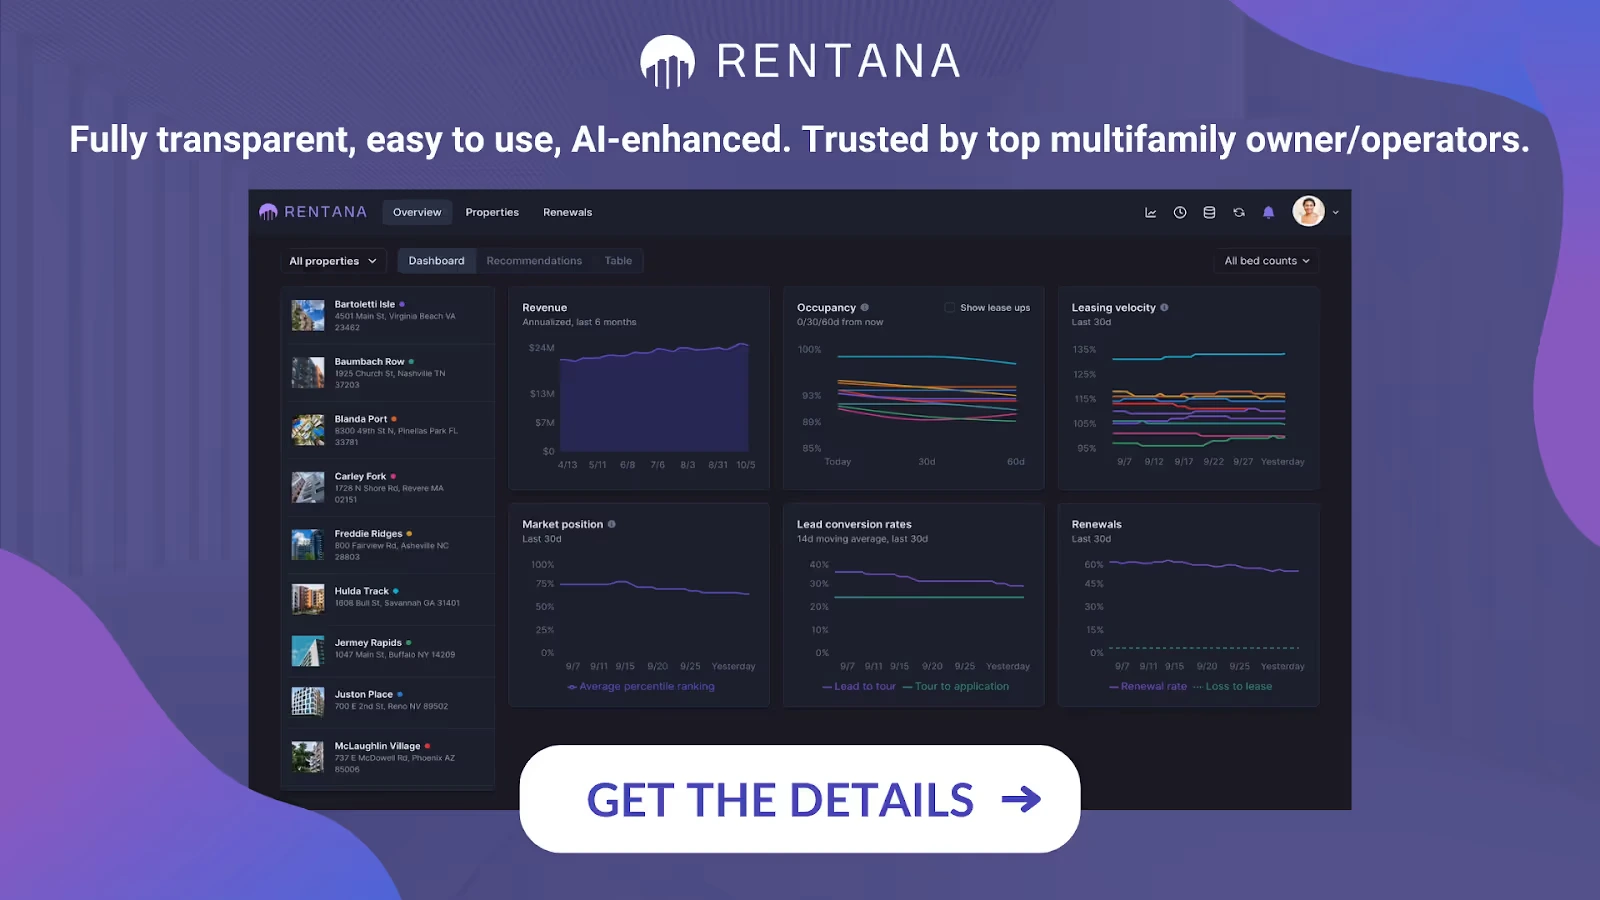
The operational gaps covered in the previous sections are not unique to any one operator or portfolio. They are structural limitations of multifamily analysis spreadsheet-based workflows that become more visible as portfolios grow and operational decisions need to move faster. What changes with a connected analytics platform is not the complexity of portfolio operations. It is the speed, visibility, and coordination behind how decisions are made.
Rentana is designed to support the areas where disconnected reporting workflows become hardest to manage at scale.
1. Automatic Data Sync from Existing PMS
Connected portfolio management starts with consistent access to current operational data. Rentana integrates directly with existing property management systems, pulling data automatically rather than waiting for someone to export, clean, and upload it on a manual schedule.
This changes how teams spend operational time. Instead of building reporting workflows around exports and reconciliation, teams can work from a shared, current view of portfolio performance. Time that was previously spent maintaining spreadsheets can shift toward evaluating leasing performance, pricing response, exposure, and portfolio priorities. Because teams are working from the same connected dataset, conversations can stay focused on decisions rather than validating which report version is correct.
2. Forward-looking Signals Alongside Historical Performance
Rentana connects leasing velocity, pricing recommendations, renewal tracking, and exposure forecasting across the portfolio. Rather than reporting on what happened, it surfaces what is changing, what that means for performance, and where teams should focus next.Teams are not limited to where occupancy stands today. They can see where performance is trending and where availability pressure is beginning to build before it becomes operationally visible.
Exposure forecasting works alongside predicted occupancy to surface where lease expiration concentration is building across the portfolio, which layouts and assets carry the most exposure risk in a given window, and how those conditions interact with current renewal trends and leasing activity.
Bringing historical performance and forward-looking operational signals into the same workflow creates earlier visibility into where conditions are shifting, giving teams more time to respond before occupancy, pricing performance, or leasing pace begin to move materially.
3. Portfolio-level Visibility with Drill-down to Property and Unit Type Detail
Rentana provides a connected portfolio view that helps operators quickly identify which assets are stable, which are beginning to drift, and where attention is needed most. Instead of manually aggregating reports across properties, teams can evaluate portfolio performance from a shared operational view.
From the portfolio level, teams can drill into individual properties, layouts, or custom unit groups without rebuilding reports or switching between disconnected workflows.
This makes it easier to move from high-level portfolio performance to the operational drivers influencing leasing pace, pricing response, renewal behavior, or future availability.
For operators managing multiple assets at once, that visibility changes how quickly teams can prioritize issues, align around performance signals, and make decisions across the portfolio.
4. Insights that Surface where to Focus
One of the biggest operational differences between disconnected reporting and connected analytics is how performance shifts are surfaced.
Rentana's AI-generated insights are designed to highlight what is changing, why it matters, and where teams may need to respond. Leasing velocity changes, pricing response, renewal trends, conversion performance, and predicted availability are connected into a consistent operational view of property performance.
Instead of requiring teams to manually identify patterns across multiple reports, insights surface where conditions are moving out of alignment with asset strategy and where attention may be needed.
For example, a slowdown in leasing pace, softening conversion, or growing future exposure can surface early with supporting context around the layouts affected, forward occupancy implications, and operational considerations tied to current conditions.
Pricing recommendations, renewal behavior, and exposure conditions are visible within the same workflow, helping teams evaluate how current decisions may impact future portfolio performance before issues become materially visible in reporting.
5. Shared Access Across Leasing, Marketing, and Asset Management
Connected portfolio management depends on shared visibility across teams.
Leasing teams, asset managers, marketing teams, and ownership can all work from the same current operational view rather than relying on separate reports updated on different schedules.
This reduces the disconnect that often develops when teams are reviewing different datasets, spreadsheets, or reporting snapshots during the same decision-making process.
Shared portfolio visibility makes it easier to align around leasing performance, pricing response, demand conditions, and future availability without requiring extensive manual reconciliation before conversations can begin.
For many operators, the operational impact becomes visible quickly. Conversations shift away from validating reports and toward evaluating what actions need to be taken across the portfolio.
Taken together, these capabilities represent the difference between documenting portfolio performance and operating from a connected system designed to support faster, more coordinated decision-making at scale.
Don’t Miss:
- Multifamily Property Data: What Operators Should Actually Track
- How to Manage a Multifamily Portfolio Smarter
Conclusion on Multifamily Analysis Spreadsheet
Spreadsheets are not going away and they should not. For the right tasks, they are still the fastest and most flexible tool available. The operators who get the most out of connected analytics platforms are not the ones who abandoned spreadsheets entirely. They are the ones who got clear about which work belongs in a spreadsheet and which work requires something better.
One-off modeling, budget tracking, acquisition analysis, and an ad hoc reporting belong in a spreadsheet. Forward-looking operational management does not. Predicted occupancy, exposure forecasting, pricing recommendations tied to current leasing conditions, and shared portfolio visibility require connected workflows designed around live operations rather than static reporting.
The operational cost of managing a life portfolio through disconnected spreadsheets is not always visible on any given day. It shows up in the decisions that were made too late, the leasing or renewal signals that existed but never surfaced clearly, and the ownership conversations that started with reconciling reportings instead of making decisions.
According to McKinsey’s research on data-driven real estate operations, by the time an investor can collect, compile, and process the data needed to distill action, the best opportunities are gone. For multifamily operators managing portfolios where leasing, pricing, and exposure decisions compound across assets over time, that response window is exactly what a connected portfolio analytics is designed to protect.
If the operational gaps in this article sound familiar, that is probably worth paying attention to. To see how connected portfolio analytics can support leasing, pricing, exposure management, and operational visibility across your portfolio, schedule a demo with Rentana.