Vacancy rate is one of the most commonly tracked numbers in multifamily real estate. It shows up in every underwriting model, every asset review, and every ownership report. Most operators can tell you their vacancy rate on any given day without looking it up.
What fewer operators can tell you is where their vacancy rate is heading, why it moved last quarter, or which specific part of their portfolio is most at risk of drifting in the next 60 days. The number is familiar. What it is actually saying is often less clear.
This article starts with the basics. The formula, the different versions of vacancy rate and when each one applies, and how to calculate it correctly without common errors that quietly distort the picture.
Then it builds outward to the part that matters more for anyone managing assets in a market where the margin for slow decisions is shrinking: what vacancy rate connects to, what it does not tell you, and what signals give you an earlier read on where it is going before it gets there.
Related:
- How to Calculate Occupancy Rate (Formula + Examples)
- How to Calculate NOI in Real Estate: Complete Guide
What Is Vacancy Rate and Why Does It Matter?
Vacancy rate measures the percentage of units in a property or portfolio that are unoccupied at a given point in time. It is one of the core indicators of asset health in multifamily real estate, used by operators to track leasing performance, by investors to underwrite acquisitions, and by lenders to assess risk.
Think of it this way. A 100-unit apartment building with 7 empty units has a 7% vacancy rate. Those 7 units are not generating rent, not contributing to NOI, and depending on how long they have been sitting, they are quietly compounding a revenue gap that shows up at the end of the year in ways that are hard to recover from.
A low vacancy rate means most units are occupied and generating revenue. A high vacancy rate means units are sitting empty and revenue is being lost. But vacancy rate is not just an operational metric. It is a financial one. Every unoccupied unit represents lost rent that cannot be recovered. Unlike a pricing mistake that can be corrected at the next lease renewal, vacancy is a permanent revenue loss for the period the unit sits empty.
The stakes are real and measurable. According to Cushman and Wakefield's Q1 2026 U.S. Multifamily MarketBeat , national multifamily vacancy was flat quarter-over-quarter at 9.4% in Q1 2026, hovering within a narrow 9.2% to 9.4% range for over a year, signaling stabilization at an elevated level while competitive leasing conditions continue to limit pricing power.
For individual assets running above that national average, the revenue impact is not abstract. It shows up directly in NOI every single month.
For investors, vacancy rate is one of the first numbers that goes into an NOI calculation. A property underwritten at 5% vacancy that runs at 9% is not just a leasing problem. It is a return problem. The gap between those two numbers, multiplied across a portfolio and compounded over a hold period, is material.
For operators, vacancy rate is the scorecard metric that everything else feeds into. Leasing velocity, renewal conversion, pricing alignment, and exposure management all ultimately show up in whether units are occupied or not. Understanding vacancy rate is the starting point. Understanding what drives it is where the real work happens.
How to Calculate Vacancy Rate for a Rental Property : Formula and Examples
There are two versions of vacancy rate worth knowing. They measure different things, and using the wrong one for the wrong purpose produces a number that looks clean but does not reflect what is actually happening at the asset.
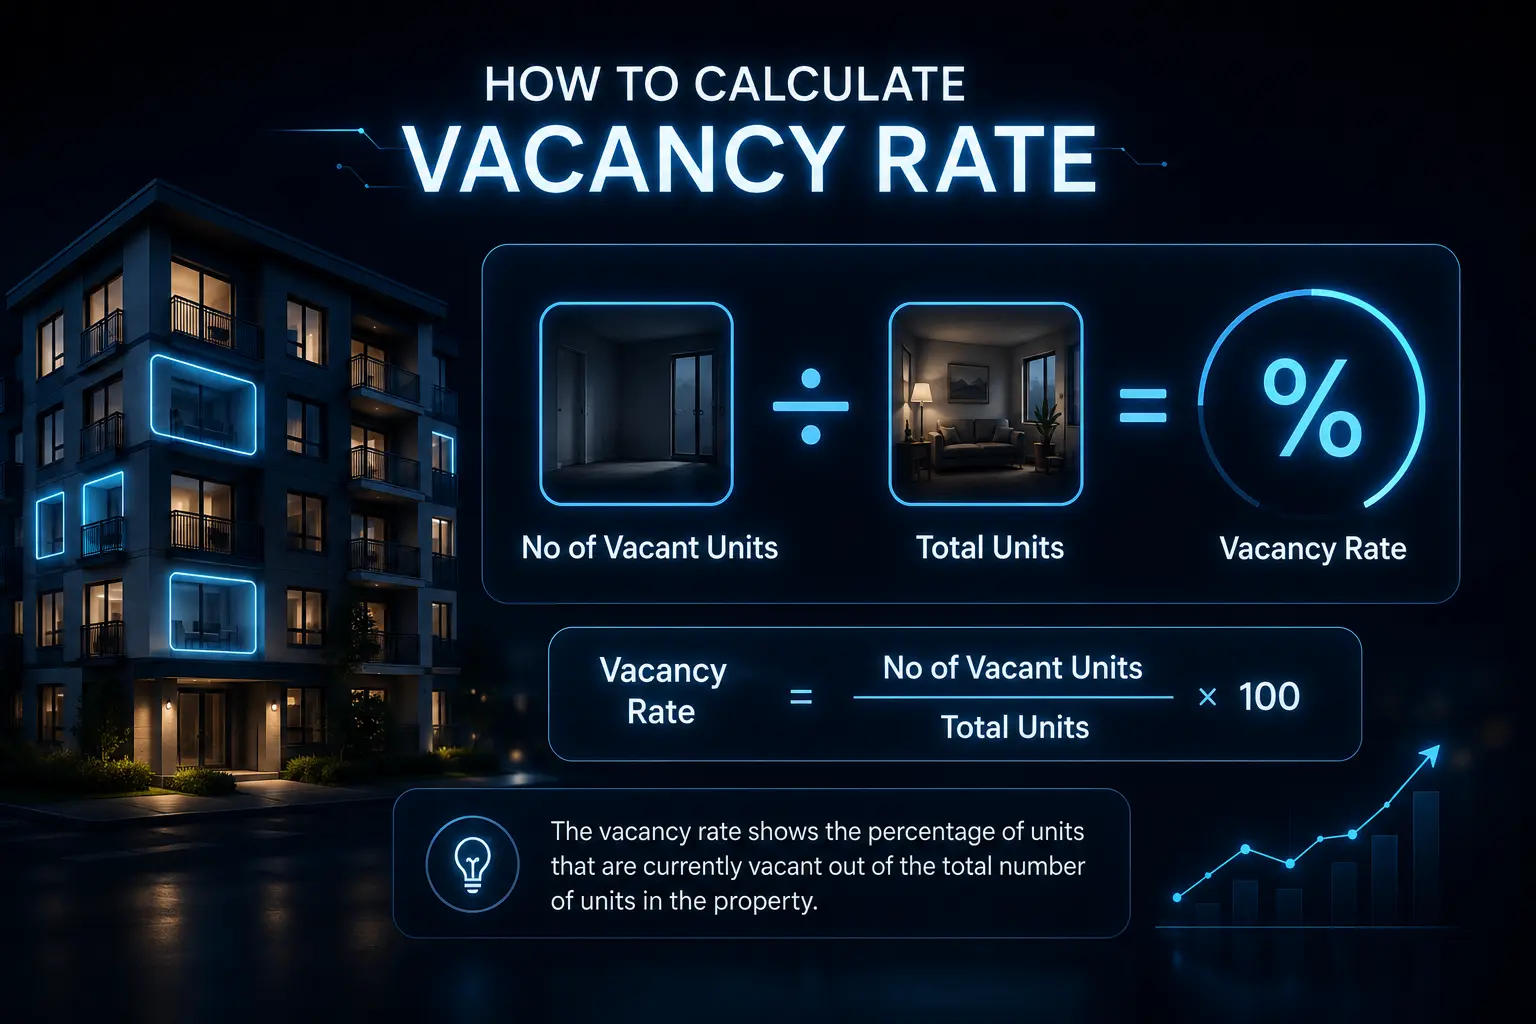
How to Calculate Physical Vacancy Rate
Physical vacancy rate measures the percentage of units that are physically unoccupied, regardless of whether they are generating any revenue.
The formula is:
Physical Vacancy Rate = (Number of Vacant Units ÷ Total Units) × 100
Example: A 200-unit property has 14 unoccupied units.
14 ÷ 200 = 0.07 × 100 = 7% physical vacancy rate
This is the version most operators refer to in day-to-day conversations. It is straightforward to calculate and easy to track over time. It tells you how many units are empty but nothing about the revenue impact of how they got there or what it is costing.
Economic Vacancy Rate (Commonly Referred to as Economic Occupancy)
Economic vacancy rate measures the percentage of potential rental income that is not being collected, whether because units are empty, occupied under a concession, or generating no revenue for another reason.
The formula is:
Economic Vacancy Rate = (Lost Revenue ÷ Gross Potential Rent) × 100
Example: A 200-unit property with a gross potential rent of $400,000 per month. Due to vacant units, concessions, and other revenue losses including bad debt, the property is only collecting $364,000. (Note that bad debt treatment varies by operator, some track it separately from vacancy, so economic vacancy calculations may differ depending on reporting convention.)
($400,000 - $364,000) ÷ $400,000 = 0.09 × 100 = 9% economic vacancy rate
Economic vacancy is almost always higher than physical vacancy because it captures revenue losses that do not show up in a unit count. A property running a concession program to sustain occupancy might look fully leased on paper while losing meaningful revenue in practice.
Read Also:
- How To Calculate the Value of a Multifamily Property Easily
- What is a Good Cap Rate for a Multifamily Property?
When to Use Each Vacancy Rate Formula
Physical vacancy rate works best for day-to-day leasing performance tracking and portfolio-level health monitoring. Economic vacancy rate is more relevant for investment analysis, underwriting, and any situation where the quality of revenue, not just the volume of occupied units, is what matters.
For most operators, tracking both gives the fullest picture. Physical vacancy tells you how many units are empty. Economic vacancy tells you how much that emptiness, and the discounting around it, is actually costing.
How to Calculate Vacancy Rate for a Rental Property Correctly (and Avoid Common Mistakes)
Knowing the formula is the easy part. Where operators consistently run into problems is in how they define the inputs and interpret the output. Small decisions about which units to include or exclude, and how to handle edge cases, can produce vacancy numbers that look clean but quietly misrepresent actual performance.
1. Including Units under Renovation or Taken Offline in your Occupied Count
A unit that is offline for any reason, renovation, damage, pest remediation, or any other condition that makes it unleasable, is not generating revenue and should not be counted as occupied. In practice, these units are sometimes excluded from the vacancy calculation entirely, which shrinks the denominator and makes the vacancy rate look better than it is.
The right approach depends on what you are trying to measure. For operational tracking, offline units should be counted as vacant unless they have a signed lease with a specific move-in date. For investor reporting, it is worth flagging them separately so the reader understands how many units are temporarily offline versus structurally vacant. The distinction matters for underwriting and for understanding true leasing performance.
2. Treating Model Units and Employee Units as Occupied
Neither model units nor employee units generating zero revenue should be counted as occupied at market rate.
Model units should either be excluded from the total unit count entirely or counted as vacant, depending on your reporting convention. What they should never be is counted as occupied.
Employee units occupied at no cost present a similar issue. A unit being used by a staff member with no rent obligation is not contributing to gross potential rent and should be flagged separately rather than counted alongside market rate occupied units.
Employee units where a partial or nominal rent is being collected are a separate consideration and how they are treated will depend on your reporting convention, but units generating zero revenue should never be counted as occupied at market rate.
3. Handling Affordable or Income-restricted Units Incorrectly
Properties with a mix of market rate and affordable units need to be careful about how they calculate vacancy across the two categories. Blending them into a single vacancy rate can mask underperformance in one segment. A property that is fully leased on the affordable side and running 12% vacancy on the market rate side has a very different operational picture than a blended 6% vacancy rate suggests.
Track affordable and market rate vacancy separately. Report them together only when the audience understands what is behind the blended number.
4. Using Point-in-time Data Instead of an Average
Vacancy rate can swing significantly from day to day depending on move-in and move-out timing. A property that had 10 move-outs on the first of the month and 8 move-ins by the fifth looks very different on the second versus the sixth. Reporting point-in-time vacancy without context can create volatility in the numbers that does not reflect actual leasing performance.
A rolling average vacancy rate, calculated over 30 or 90 days, or the average vacancy for the full calendar month, gives a more stable and accurate picture of where the asset actually stands. For ownership reporting, either of these is almost always more useful than a single point-in-time number.
5. Misreading Vacancy Rate as the Full Performance Picture
Vacancy rate tells you that units are empty. It does not tell you why they are empty, how long they have been empty, or what is likely to happen next. Acting on vacancy rate without understanding the upstream drivers leads to the wrong response.
A property with low vacancy but high loss-to-lease, the gap between what units are currently leased for and what they could be leased for at current market rates, has a pricing problem, not a leasing problem. A property with rising vacancy and slowing leasing velocity has a demand or pricing alignment problem.
A property with rising vacancy and healthy leasing velocity has a turnover problem. Each of these requires a different response, and vacancy rate alone does not tell you which one you are dealing with.
Calculating vacancy rate correctly is the starting point. Interpreting what it is telling you about your specific situation is where the real operational work begins.
Related:
- 9 Tenant Retention Strategies that Improve Multifamily NOI
- How to Centralize Leasing Without Losing Resident Experience
What Your Vacancy Rate Is Actually Telling You, and What It Is Not
Vacancy rate is useful. It is also limited in ways that matter a lot for operators who are trying to manage performance rather than just report it.
The number tells you where occupancy stands today. It does not tell you why it got there, whether it is about to get better or worse, or which specific part of your portfolio is most at risk of drifting in the next 60 days. For a metric that shows up in every ownership report and every investment analysis, that is a significant gap.
How Vacancy Rate Connects to other Metrics
Vacancy rate does not exist in isolation. It is the outcome of several upstream variables, each of which tells you something more specific about what is driving performance.
Leasing velocity tells you how quickly available units are being absorbed. A property with rising vacancy and slowing leasing velocity has a demand or pricing problem. A property with rising vacancy and healthy leasing velocity has a turnover problem. The distinction matters for knowing where to focus.
Renewal conversion tells you how many existing residents are choosing to stay. A 5% vacancy rate driven by low renewals is a different operational problem than a 5% vacancy rate driven by slow new leasing.
One points to a retention issue. The other points to a marketing or pricing issue. And when renewal conversion softens gradually over several weeks, it rarely shows up in the vacancy rate until leases start actually turning over, which is often too late to respond cost effectively.
Exposure forecasting tells you where vacancy is likely to build before it actually builds. A concentration of lease expirations in a specific bedroom type over the next 60 days, combined with softening renewal conversion in that same layout, is a forward signal that vacancy is heading somewhere specific. That signal exists in the data weeks before it appears in the vacancy rate.
The operators who catch it early can respond with targeted renewal outreach, lease term pricing adjustments, and proactive marketing. The ones who catch it in the vacancy number are already behind.
NOI is where vacancy ultimately shows up financially. A 1% increase in vacancy across a 300-unit asset at $1,800 average rent is $5,400 in lost monthly revenue. Annualized, that is $64,800. Across a ten-asset portfolio, the math compounds quickly. And unlike a pricing adjustment that can be corrected at the next lease cycle, vacancy loss for the period a unit sits empty is permanent. It cannot be recovered.
Why Vacancy Rate is a Lagging Indicator
This is the most important limitation to understand. By the time vacancy rate moves, the decisions that determined where it landed have already been made, or missed. A renewal conversation that happened too late, a pricing adjustment that was delayed by a week, an expiration concentration that nobody flagged until it was already creating pressure. All of those show up in the vacancy rate after the fact.
McKinsey's research on real estate analytics makes the broader point clear: the operators who act on emerging signals early consistently outperform those who wait for confirmation in lagging metrics.
The same principle applies to vacancy management. The operators who are protecting NOI are not the ones who respond to vacancy rate after it moves. They are the ones watching the signals that predict where it is going while there is still time to do something about it.
How to Move Beyond Vacancy Rate to What is Driving it
Tracking vacancy rate is the floor. Understanding what is driving it, and where it is likely to go next, is where the real operational leverage is.
That means connecting vacancy data to the signals upstream. Where is leasing velocity slowing? Which unit types are taking longer to absorb? Which bedroom types are taking longer to absorb? Where is renewal conversion softening relative to upcoming expirations? Which assets are showing early signs of drift before they show up in the occupancy numbers?
These are not questions the vacancy rate can answer on its own. They require a layer that connects the lagging metric to the leading signals, which is exactly what Rentana is built to provide.
Rentana surfaces two distinct forward views. The 30 and 60 day occupancy figures reflect known move-ins and move-outs already in the system, a near term picture based on executed activity. Predicted occupancy connects current leasing activity, renewal trends, and future availability to provide forward visibility into where occupancy is heading. Together they give teams a layered forward view of what is already locked in and what is likely to happen if current conditions hold.
Exposure forecasting surfaces where lease expiration concentration is building, by bedroom type, before it creates vacancy pressure. AI generated property insights flag what is changing at a specific asset, explain why it matters in context, and connect to a supported action, so teams are not left interpreting a vacancy number after the fact and working backward to understand what happened.
The portfolio dashboard gives leasing managers, asset managers, and ownership a shared, color coded view of asset health across the full portfolio, so the assets drifting toward a problem are visible before they become one.
For operators who have been managing their portfolio by watching vacancy rate, the shift to leading signals is not a technology change. It is an operational one. The vacancy rate will always tell you what happened. The question is whether your current tools are telling you what is about to happen while there is still time to change it.
Don’t Miss:
- Multifamily Rent Pricing Strategy: A Complete Guide for Investors
- How to Forecast Occupancy in Multifamily Real Estate
Conclusion
Vacancy rate is one of the most important numbers in multifamily real estate. It is also one of the most misunderstood, not because the formula is complicated, but because the number alone does not tell you much about what is actually happening or where things are heading.
The operators managing vacancy well are not just the ones tracking it accurately. They are the ones who understand what is driving it, which upstream signals to watch, and how to act on those signals before they show up in a number that has already moved.
Vacancy rate tells you where you have been. The question worth asking is what your data is telling you about where you are going.
If the honest answer is that you are not sure, that is worth looking into before the next ownership report tells you something you could have seen coming weeks earlier.
Frequently Asked Questions on How to Calculate Vacancy Rate for a Rental Property
What is the Formula for Vacancy Rate?
The vacancy rate formula is: (Number of Vacant Units ÷ Total Number of Units) × 100. For example, a 200-unit property with 14 vacant units has a vacancy rate of 7%. There are two versions worth knowing: physical vacancy rate, which counts empty units as a percentage of total units, and economic vacancy rate (commonly referred to as economic occupancy), which measures lost revenue as a percentage of gross potential rent.
What is the Difference between Physical Vacancy and Economic Occupancy?
Physical vacancy counts the units that are empty. Economic occupancy measures the percentage of potential rental income that is actually being collected. The two numbers diverge when a property is running concessions, carrying bad debt, or has units occupied at below market rates.
What is a Healthy Occupancy Rate for Multifamily?
There is no universal answer. What matters is what your specific submarket can support, not a national benchmark. A property targeting 95% occupancy in a market that can only absorb 92% will chase that gap through concessions and aggressive renewal offers, eroding the rent roll in the process. The occupancy number may improve but effective rent declines and the damage compounds over the life of those leases.
What is an Ideal Vacancy Rate and How does it Vary by Market?
For multifamily real estate, a vacancy rate between 4% and 7% has historically been considered healthy at the property level, though national benchmarks have shifted significantly in recent years. According to Cushman and Wakefield's Q1 2026 U.S. Multifamily MarketBeat, the national multifamily vacancy rate stood at 9.4% in Q1 2026, hovering within a narrow range for over a year, with Class A vacancy declining while Class B and C vacancy increased.