If you manage real estate long enough, you learn one thing quickly: decisions are only as good as the visibility behind them.
Most operators, investors, and asset managers are surrounded by data; occupancy reports, leasing updates, pricing spreadsheets, renewal trackers, expense summaries. All the information exists. The challenge is that it lives in different places, updates at different times, and rarely tells a clear story on its own.
That is where a real estate dashboard turns scattered data into a clear operating picture.
A well-designed real estate dashboard does more than display numbers. It connects performance signals, highlights risk, and helps teams move from reacting to planning. Whether you are overseeing a single property or a full portfolio, the right dashboard changes how quickly and confidently you make decisions.
In this guide, we break down nine real estate dashboards that help operators, investors, and multifamily teams turn data into action and make better decisions every day using a modern real estate dashboard approach built for real-time visibility
Related: 9 Real Estate Market Insights Managers Can’t Ignore
9 Real Estate Dashboards for Better Decisions

- Real Estate Portfolio Dashboard
- Multifamily Performance Dashboard
- Rent Pricing & Revenue Dashboard
- Occupancy & Vacancy Tracking Dashboard
- Lease Renewal & Retention Dashboard
- Investment & NOI Performance Dashboard
- Leasing & Lead Conversion Dashboard
- Market & Competitive Analysis Dashboard
- Reporting & Analytics Dashboard
1. Real Estate Portfolio Dashboard
A real estate portfolio dashboard is the view investors and multi-property operators rely on when they need to understand the big picture fast. Instead of looking at properties one by one, it pulls performance into a single place so you can see how the entire portfolio is trending. Occupancy, rent growth, vacancy exposure, renewal pressure, and revenue performance all become easier to compare when they are side by side.
This matters because portfolio risk is rarely obvious in isolation. One property may look stable, while another is quietly slipping through slower leasing or rising concessions. A portfolio dashboard helps you spot those gaps early, prioritize attention, and avoid surprises that only show up after month-end reporting.
Platforms like Rentana support this kind of visibility by connecting unit-level performance within a real estate dashboard that surfaces trends across properties in one place, and market signals across properties, through a portfolio dashboard that uses visual performance indicators to show how each property is tracking against key targets. Operators can quickly see occupancy versus projected occupancy, renewal conversion performance, leasing demand signals and recent pricing activity in a single view.
This makes it possible to identify which properties are performing as expected, which are falling behind and what operational factors may be driving those changes. By pairing performance indicators with clear insights and suggested next steps, the dashboard helps teams move beyond static summaries and toward faster, more confident portfolio decisions.
Related: The Best AI Tools for Real Estate Investors
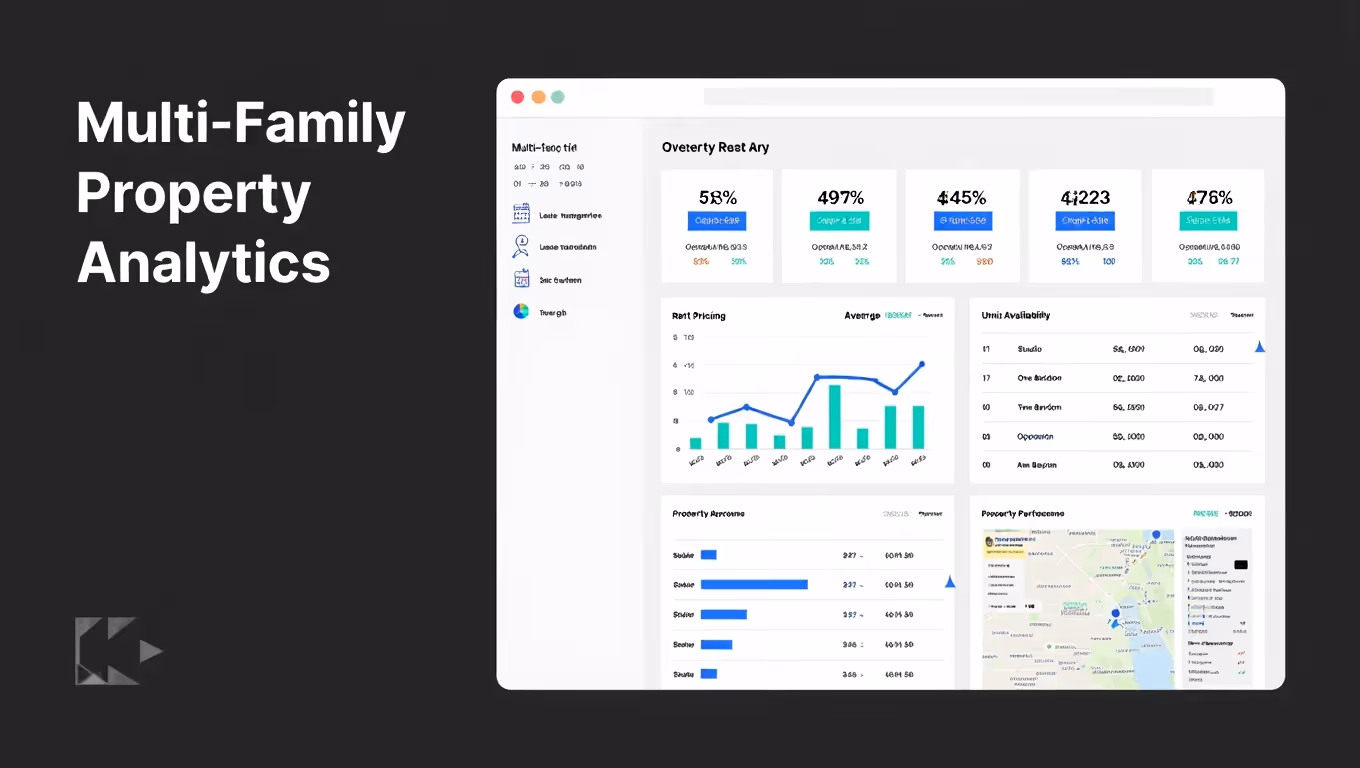
2. Multifamily Performance Dashboard
A multifamily performance dashboard focuses on what is happening inside each property, not just across the portfolio.
It brings together core operational metrics like occupancy, effective rent, leasing velocity, renewal rates, and days vacant so teams can quickly understand whether a property is on track or drifting. Rather than viewing these metrics in isolation, the dashboard connects performance trends, upcoming exposure, and leasing activity into a single operating view that reflects how the property is performing today and where pressure may build next.
Unlike high-level financial summaries, this real estate dashboard is built for daily and weekly decision-making. It helps asset managers and property teams answer practical questions:
Are certain floor plans underperforming? Is leasing slowing compared to last month? Are renewals converting at expected levels? Small shifts in these metrics often signal larger trends forming beneath the surface.
By pairing current performance with forward-looking indicators like upcoming expirations, demand activity, and conversion movement, teams can spot risk earlier and prioritize where attention is needed most.
When designed well, a multifamily performance dashboard does more than report numbers. It highlights pressure points, surfaces inconsistencies, and helps teams act before performance declines.
This level of visibility is especially important in competitive leasing environments, where timing and responsiveness directly affect occupancy and NOI. A strong real estate dashboard makes it easier to understand what is driving performance changes, not just where performance stands.
This is also where revenue intelligence becomes essential. Multifamily teams need more than static reporting, they need forecasting and forward-looking insight. Rentana helps teams create performance dashboards by surfacing demand signals, pricing context, and unit-level trends in real time, helping operators understand not just what is happening, but what is likely to happen next and where to act first within a centralized real estate dashboard experience designed for daily operational use.
Related: How to Build Property Performance Dashboards for Multifamily
3. Rent Pricing and Revenue Dashboard
A rent pricing and revenue dashboard is built for one of the most important questions in multifamily: are we pricing units in a way that matches demand and protects income?
This real estate dashboard tracks how rents are trending across unit types, where pricing power is strengthening, and where revenue may be slipping through longer vacancy or unnecessary concessions. It helps operators see whether rent changes are actually improving performance or creating leasing friction. By connecting pricing movement with leasing activity, exposure, and absorption trends, teams can better understand how pricing decisions are influencing results across the property.
What makes this dashboard especially valuable is that pricing is never static. Leasing conditions shift throughout the year, and timing can influence how quickly units move and how much revenue is captured.
Demand shifts by season, submarket, and competitive supply, so teams need visibility that reflects current market behavior. Platforms like Rentana support rent pricing insights within a real estate dashboard by combining internal performance signals with real-time leasing activity, helping operators understand pricing in context and make smarter adjustments based on live leasing behavior and demand patterns rather than assumptions.
4. Occupancy and Vacancy Tracking Dashboard
An occupancy and vacancy tracking dashboard gives operators a clear view of how full a property really is and where exposure may be building. It goes beyond a single occupancy percentage and breaks down availability by unit type, lease expiration timing, and days vacant. By showing how current occupancy connects to upcoming expirations and available inventory, it helps teams understand both current position and near-term risk.
This matters because vacancy rarely shows up all at once. It builds gradually through slower leasing, stacked expirations, or weak renewal conversion. A well-designed dashboard helps teams spot those patterns early instead of reacting after occupancy drops. Early visibility allows teams to prioritize leasing focus, adjust timing, and stabilize performance before pressure increases.
In multifamily, even small increases in vacancy can meaningfully affect NOI. That is why tracking occupancy trends in real time is critical. Platforms like Rentana support this by connecting occupancy data with demand signals and forecasting insights, within a real estate dashboard designed that highlights current exposure alongside projected availability, helping operators understand not just how full a property is today, but where availability risk may appear next.
Related: How to Forecast Occupancy in Multifamily Real Estate
5. Lease Renewal and Retention Dashboard
A lease renewal and retention dashboard focuses on one of the most overlooked drivers of multifamily income: keeping residents in place. Renewals stabilize occupancy, reduce turnover costs, and protect revenue far more efficiently than constantly backfilling vacant units. Because renewal outcomes directly influence both short-term occupancy and long-term revenue stability, heaving clear visibility into upcoming decisions is critical.
This real estate dashboard tracks renewal offers, acceptance rates, upcoming expirations, and retention performance by unit type or floor plan. It helps teams see where renewal pressure is building and whether pricing or timing decisions are affecting resident behavior. By organizing upcoming renewals alongside performance targets, operators can better plan outreach and avoid last-minute gaps in occupancy.
Renewal strategy is especially important because it is not just about sending notices. It is about offering the right terms at the right moment, based on demand and market conditions. Rentana helps with lease renewal management by surfacing unit-level performance trends and market signals as leases approach expiration within a real estate dashboard that supports better renewal visibility and planning, helping operators guide renewal timing and pricing with greater clarity and confidence.
Related: Lease Renewal Agreement: How to Manage The Entire Process Easily
6. Investment and NOI Performance Dashboard
An investment and NOI performance dashboard is built for owners, asset managers, and investors who need to understand how properties are performing financially. It tracks revenue trends, operating expenses, net operating income, and margin performance across properties and time periods. By bringing financial performance into one view, it helps connect day-to-day operations with long-term investment outcomes.
This dashboard helps answer bigger strategic questions: Is NOI growing at the pace we expected? Are expense increases offsetting rent growth? Which properties are outperforming underwriting assumptions? Instead of waiting for quarterly reports, investors can see how financial performance is trending in real time. This allows teams to identify shifts earlier and understand where performance is strengthening or weakening across the portfolio.
In multifamily, NOI is heavily influenced by pricing execution, occupancy stability, and renewal performance. A Revenue intelligence platform like Rentana helps investors connect operational performance, pricing activity, and unit-level trends to overall revenue movement through a real estate dashboard that links operational activity to financial outcomes, helping operators understand what is driving NOI shifts rather than just seeing the outcome after the fact.
Related to NOI: How to Increase NOI for Multifamily
7. Leasing and Lead Conversion Dashboard
A leasing and lead conversion dashboard focuses on the front end of performance: how interest turns into signed leases. It tracks lead volume, lead-to-tour ratios, tour-to-application conversions, response times, and overall leasing velocity. By showing how prospects move through each stage of the leasing funnel, it helps teams understand where momentum is strong and where breakdowns may be occurring.
This real estate dashboard is important because high lead volume does not automatically mean strong performance. If tours are not converting or applications are slowing down, something is misaligned. It could be pricing, competition, responsiveness, or even messaging. Without visibility into the full funnel, teams may assume demand is healthy when conversion tells a different story.
Even small gaps between tours, applications, and signed leases can create meaningful exposure if they go unnoticed. Visibility into lead sources and conversion by marketing channel also helps teams understand which efforts are driving qualified traffic and where marketing spend is producing the strongest results.
By pairing leasing funnel metrics with performance visibility, operators can identify where friction exists and adjust strategy before vacancy builds, using insights surfaced within a real estate dashboard that highlights conversion patterns and leasing activity in real time.
Rentana supports this by surfacing leasing activity, conversion patterns, and marketing source performance within a real estate dashboard, helping operators identify friction in the funnel, improve follow-up processes, and make more informed decisions about where to focus leasing attention and marketing investment.
8. Market and Competitive Analysis Dashboard
A market and competitive analysis dashboard gives operators visibility beyond their own properties. It tracks local supply deliveries, competitor pricing trends, concession activity, and submarket occupancy patterns. It brings together high-level external indicators such as supply activity, leasing momentum patterns, and broader performance benchmarks to help teams understand how conditions are shaping performance.
This real estate dashboard is critical because performance does not happen in isolation. A property may experience slower leasing not because of internal issues, but because new supply delivered nearby or competitors began offering aggressive concessions. Without market context, operators risk adjusting strategy in the wrong direction.
With Rentana, operators can leverage public market data alongside property-level performance within a real estate dashboard that brings external signals and internal performance into one view, helping teams respond with greater clarity rather than reactive guesswork. This helps teams understand how outside conditions may be contributing to performance changes while keeping decision-making grounded in their own operational data.
Related: How to Do a Rental Market Analysis Like a Pro (With AI Tool)
9. Reporting and Analytics Dashboard
A reporting and analytics dashboard is the backbone of how multifamily teams communicate performance. It pulls together the metrics that owners, operators, and asset managers need for weekly check-ins, monthly reporting, and strategic planning. By centralizing information in one place, it creates alignment across teams and ensures everyone is working from the same performance view.
The value of this dashboard is consistency. When reporting is manual or fragmented, teams spend more time building reports than acting on them. A strong analytics dashboard creates a shared source of truth across leasing, revenue, renewals, and portfolio health. This makes it easier to track progress, identify shifts, and support more informed conversations at every level of the organization.
Modern platforms are moving beyond static reporting by adding intelligence on top of the data. Rentana helps transform reporting dashboards into decision-support systems by turning a traditional real estate dashboard into a forward-looking planning tool that surfaces trends, highlights potential risks, and provides actionable insights that help teams move from describing performance to improving it.
Conclusion on Real Estate Dashboard
Real estate dashboards are no longer just reporting tools. In today’s market, they are decision tools. The right dashboard helps investors and operators see performance clearly, spot risk early, and act with confidence before small issues become revenue losses.
Whether you are tracking portfolio health, pricing strategy, occupancy exposure, renewal outcomes, or competitive movement, or operational performance trends, dashboards create the visibility needed to operate proactively rather than reactively.
And as multifamily becomes more data-driven, platforms like Rentana are helping teams go beyond static charts by using a centralized real estate dashboard to turn real-time signals and unit-level performance into actionable revenue intelligence.
The question is not whether you have dashboards. It is whether your dashboards are helping you make better decisions every day.