Multifamily rental
Total Units
10 units
Occupied Units
8 units leased
Calculation
8 ÷ 10 × 100
Occupancy Rate
80%
If you own or manage a rental property, occupancy rate is one of the most commonly used metrics in property management. It may sound technical, but it is actually one of the simplest and most useful numbers you can track.
The occupancy rate reflects how much of a property’s available inventory is generating rental income. We will break down what occupancy rate means, how to calculate it, and what the numbers look like in real life. By the end, you will be able to calculate your own occupancy rate with confidence and use it to make better decisions for your property.
Related: How to Forecast Occupancy in Multifamily Real Estate
Occupancy rate is a percentage that measures how much of a property’s available rental inventory is occupied during a given period of time. In simple terms, it answers one question: What percentage of available space is occupied instead of sitting vacant?
For example, if you have a rental unit that was available for 30 days and it was occupied for 24 of those days, your occupancy rate is 80 percent. Higher occupancy rates indicate more consistent use of available units and stronger income utilization.
Occupancy rate is a percentage that measures how much of a property’s available rental inventory is occupied during a given period of time.
In simple terms, it answers one question: What percentage of available space is occupied instead of sitting vacant?
For example, if you have a rental unit that was available for 30 days and it was occupied for 24 of those days, your occupancy rate is 80%. Higher occupancy rates indicate more consistent use of available units and stronger income utilization.
Occupancy rate is used across many property types, including multifamily residential, short-term rentals, and hotels. While the calculation itself remains the same, how the metric is interpreted and applied can vary depending on the operating model.
In real estate, occupancy rate is commonly used to measure how well a property or portfolio is performing. Investors and property managers rely on it to understand demand, compare assets, and identify areas of underperformance. residential real estate, the occupancy rate typically reflects how consistently units are leased over a given period. In commercial real estate, it often indicates how much of a building’s total rentable space is currently in use.
Occupancy plays an especially important role in multifamily residential real estate. Owners and operators use it to track renter demand, benchmark properties, and identify underperforming units before revenue is affected. In fact, the national multifamily occupancy rate has remained near the mid-90 percent range, with the U.S. average around 94.5 percent for several months in 2025, highlighting strong demand even as new units come online.
Looking ahead, occupancy rate is expected to remain a primary performance focus for multifamily operators, as softer demand and continued new supply place greater emphasis on retention and occupancy stability over rent growth.
Related: How To Do A Rental Market Analysis Like a Pro (With AI Tools)
For long-term rental properties, occupancy rate shows how consistently units are leased throughout the year. It helps landlords and property managers understand the impact of tenant turnover, vacancy between leases, and seasonal demand patterns.
A rental property with a high occupancy rate typically experiences fewer gaps between tenants, while a lower occupancy rate may signal pricing misalignment, location challenges, or marketing and leasing inefficiencies.
In the hotel industry, occupancy rate measures the percentage of available rooms that are booked over a given period, such as a night, week, or month.
Hotel operators analyze occupancy rate alongside other metrics like average daily rate (ADR) and revenue per available room (RevPAR) to evaluate performance. Because hotel bookings fluctuate daily, hotel occupancy rates tend to be more volatile than those in long-term rental properties.
For short-term rentals, occupancy rate tracks the number of booked nights compared to total available nights. This metric is commonly used for vacation rentals and furnished short-term stays.
Short-term rental occupancy rates can vary significantly based on seasonality, pricing, location, and traveler demand. In this market segment, a lower occupancy rate does not always indicate poor performance, especially when higher nightly rates offset fewer booked nights.
Read Also: The Best AI Tools for Real Estate Investors
Occupancy rate is one of the simplest and most effective ways to understand how a property is performing. For landlords, property managers, and investors, it directly influences income planning, operational decisions, and long-term strategy.
More than a reporting metric, occupancy rate is a leading performance signal. When tracked consistently and viewed alongside demand, pricing, and leasing activity, it helps teams identify where performance is strong, where risk is emerging, and where attention is needed before revenue is impacted.
Occupancy rate plays a critical role in realistic revenue forecasting. Rather than assuming full occupancy, it helps owners and investors project income based on how a property actually performs. For example, if a property averages an 88 percent occupancy rate, forecasting revenue at 100 percent occupancy will almost always overstate expected income. Using real occupancy trends instead provides a clearer view of cash flow and reduces budgeting surprises.
Platforms like Rentana support this by surfacing historical and trending occupancy at the portfolio, property, and unit levels, allowing forecasts to reflect actual performance rather than assumptions
Occupancy rate is one of the fastest indicators of whether pricing is aligned with demand.
Sustained high occupancy can signal that rents may be below market, while a sudden drop following a rent increase may indicate greater price sensitivity than expected. The value comes from spotting these shifts early and understanding the context behind them. By viewing occupancy trends alongside demand signals and market conditions, teams can make more informed pricing adjustments instead of reacting acter vacancy increases.
Platforms like Rentana support this by connecting occupancy performance with public market data and AI-powered pricing guidance, helping property managers to adjust pricing with confidence rather than guesswork.
Occupancy rate helps distinguish surface-level results from underlying performance trends.
A property may post strong revenue in a given month while occupancy quietly declines, which is often an early signal of increased competition, pricing misalignment, or resident friction.
Tracking occupancy over time provides clearer insights into demand stability and operational effectiveness. Consistent occupancy typically reflects healthy market alignment, while gradual declines highlight where attention may be needed before revenue is affected.
With Rentana’s red, yellow, and green portfolio views, teams can quickly see which properties are on track and which are beginning to fall behind, making it easier to prioritize action across large multifamily portfolios
Occupancy rate allows you to compare performance across different properties or different time periods using the same benchmark.
For example, you can compare two similar rental units, layouts, and floorplans, to see occupancy performance variances. You can also compare monthly, quarterly and year over year occupancy rates to understand whether performance is improving or declining.
Because occupancy rate is standardized, it gives landlords and property managers a reliable way to evaluate trends, assess market changes, and make data-driven decisions.
Related: What is a Good IRR for Rental Properties
Occupancy rate provides a consistent benchmark for comparing performance across properties and over time. Because it is standardized, it allows teams to evaluate results without relying on raw revenue alone.
Landlords can compare similar units to see which lease more consistently.. Investors can assess how the same property performs year over year. Property managers can benchmark assets across markets and portfolios to identify relative strengths and weaknesses.
Platforms like Rentana make this easier by allowing users to group properties by asset type, geography, client, or portfolio and compare occupancy trends side by side, turning performance data into actionable insight.
Occupancy rate is most valuable when it is used as a forward-looking signal, not just a historical report.
Tracking how occupancy trends over time helps teams anticipate slowdowns, plan leasing strategies, and make adjust\ before performance declines. This is especially valuable in seasonal markets or rapidly changing markets.
Rentana’s forecasting tools support this by pairing predicted occupancy with demand and availability insights, enabling landlords and investors to move from reactive decisions to more proactive, data-driven strategy
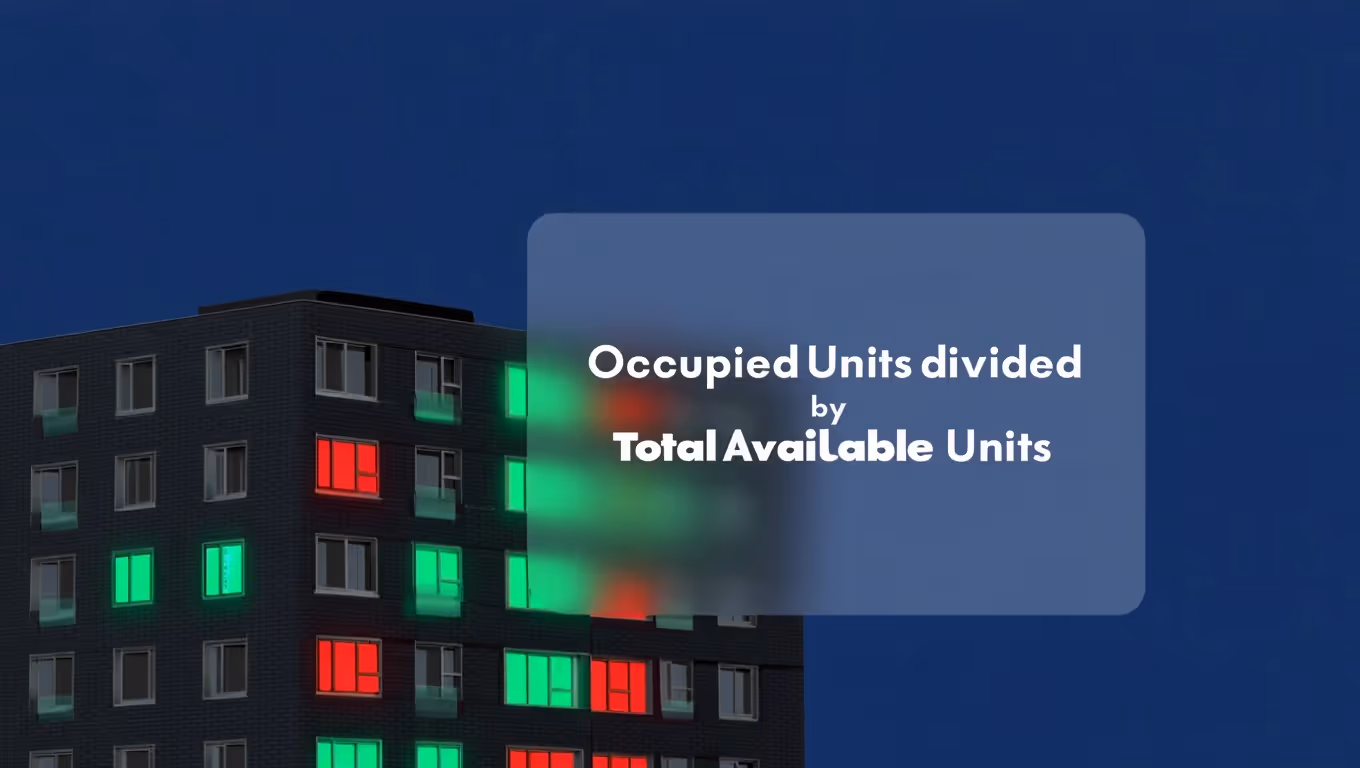
The occupancy rate formula is simple. Once you understand the pieces, you can calculate it for almost any type of property.
Occupancy Rate = (Number of occupied units or days ÷ Total available units or days) × 100
This formula works the same way whether you are calculating occupancy for a single unit, an entire property, or a portfolio.
Start by identifying how much inventory you had available during the period you are measuring.
Long-term rentals (multifamily): Total number of units available to lease during the period.
Short-term rentals: Total number of nights the units(s) are available for booking.
Hotels: Total number of room nights available (number of rooms x number of days in the period).
Next, determine how much of that inventory was actually occupied.
Long Term Rentals (multifamily): Number of units leased during the period
Short-term Rentals: Number of nights booked during the stay
Hotels: Number of room nights sold (rooms occupied x number of days)
Related: How To Calculate the Value of a Multifamily Property Easily
Now divide the occupied number by the total available number,which gives you a decimal that represents how much of your inventory was used. Multiply this by 100 to convert this into a percentage. This final number is your occupancy percentage
Occupancy Rate = (Occupied Inventory ÷ Total Available Inventory) x 100
When calculating occupancy rate, the time period must be consistent. If you are measuring monthly occupancy, both the occupied and available inventory should reflect that same month. The same principle applies to quarterly or annual calculations.
Using a consistent time frame is what makes occupancy rate a reliable metric for tracking performance trends and comparing results over time.
Related: How to Create Multifamily Property Performance Dashboards
Occupancy rate is simple to calculate, but it is easy to misinterpret or apply incorrectly. Small mistakes in how it is measured, compared, or acted on can lead to misguided decisions.
Just as important, improving occupancy rate often comes down to a few controllable factors. Understanding where teams commonly go wrong, and what actually moves the metrics, helps turn occupancy rate from a passive number into a practical performance tool.
One of the most common mistakes is mixing time periods. For example, using annual availability but only counting occupied inventory from a single month will distort the result.
Always ensure that both occupied and available inventory cover the same time period, whether that is a monthly, quarterly, or yearly.
Another frequent error is counting units as available when they were not actually rentable. Units under renovation, held off-market, or intentionally taken offline should should be excluded from available inventory.
Including them will artificially lower your occupancy rate and misrepresent actual performance.
A lower occupancy rate is not always a sign of poor performance. For example, a short-term rental with lower occupancy may still outperform a fully occupied long-term rental if pricing is higher.
Evaluating occupancy rate without considering rent levels, demand, or market conditions, can lead to incorrect conclusions.
Occupancy rate is not a one-time calculation. Relying on a single snapshot can hide important trends.
Tracking occupancy over time provides deeper insight into demand shifts and performance changes than focusing on one month or property in isolation.
Related: Rent Concession Meaning: 7 Examples & Use Cases (2026)
Pricing has one of the biggest impacts on occupancy rate. If units sit vacant for extended periods, the market may be signaling that pricing is misaligned with demand.
Testing small pricing adjustments, offering limited-time incentives, and responding quickly to demand shifts can help improve occupancy without undermining long-term revenue.
Weak photos, unclear descriptions, or limited distribution can reduce demand even in strong markets.
High-quality images, clear unit details, and consistent exposure across listing platforms make it easier for prospective renters or guests to move forward quickly.
High turnover increases vacancy days which puts downward pressure on occupancy over time.
Timely responses to maintenance requests, clear communication, and fair, well-timed renewal pricing help residents stay longer and reduce gaps between leases.
Occupancy improves when it is actively tracked.
Reviewing occupancy trends monthly or quarterly identify issues early, such as rising vacancy, slower leasing, or seasonal shifts in demand.
Occupancy rate is most effective when viewed alongside other performance indicators, such as rent levels, lease trade-outs, and market demand.
Using occupancy in context gives landlords, property managers, and investors a clearer understanding of what is driving performance and where adjustments will have the greatest impact.
Don’t Miss: The Best PropTech Software for Multifamily Investors
Occupancy rate is one of the simplest metrics in real estate, but it carries significant weight. It reflects how efficiently a property is being used, how predictable income is likely to be, and where there may be opportunity to improve performance. When calculated consistently and tracked over time, occupancy rate becomes a reliable signal for smarter, more proactive decision-making.
For landlords, property managers, and investors managing multiple units or portfolios, tracking occupancy manually can quickly become time-consuming and prone to error. This is where having the right tools matters. Platforms like Rentana bring occupancy data together with pricing, demand, and public market context, helping teams understand not just the number, but what is driving it and how to respond.
Whether you are evaluating a single property or overseeing a portfolio, keeping a close eye on occupancy rate and pairing it with clear, actionable insights puts you in a stronger position to protect revenue and stay ahead of changing market conditions.
80% occupancy means that 80% of the available units or rooms are currently occupied. For example, if a property has 100 units, 80 of them are rented or in use.
To calculate room occupancy, divide the number of occupied rooms by the total number of available rooms, then multiply by 100 to get a percentage.
Average occupancy rate is calculated by dividing total occupied units or rooms over a specific period by the total available units or rooms, then multiplying by 100.
60% occupancy means that 60% of the total available units or rooms are filled, while 40% remain vacant. This may indicate weaker demand or seasonal slowdowns.
The occupancy rate (OCC) formula is:
Occupancy Rate = (Occupied Units ÷ Total Available Units) × 100
A good hotel occupancy rate is typically between 70% and 85%, depending on location, season, and market conditions. Higher occupancy generally signals strong demand and revenue performance.
In Excel, the occupancy rate formula is: Occupied Units/Total Units*100. For example:B2/A2*100, if A2 is total rooms and B2 is occupied rooms.