The traditional model of multifamily investing had a clear rhythm. You acquired an asset, stabilized it, monitored performance through monthly and quarterly reports, and made adjustments when the numbers told you something had gone wrong. The reporting was retrospective by design. It told you what had already happened and gave you a basis for deciding what to do next.
That model worked well enough in a market that moved slowly and forgave slow responses. It works less well in the market that exists today.
Conditions shift faster now. A submarket that absorbed new supply smoothly six months ago looks different when two more lease-ups open in the same corridor. A renewal retention rate that was healthy in Q1 can deteriorate quietly through Q2 if nobody is watching the right signals. A pricing strategy that made sense when the asset was stabilized can drift out of alignment with actual demand conditions over months without triggering anything obvious in a standard financial report.
By the time these shifts show up clearly in NOI, the window for a low-cost response has usually already closed. The asset is not broken. But it is underperforming relative to what it could have been doing, and the gap between actual and potential return has been compounding quietly for longer than the reporting suggested.
This is the problem AI is solving for multifamily investors. Not by replacing the judgment calls that define good investing, but by changing what investors can see and when. Portfolio-level signals that surface drift before it reaches the financials. Forward-looking indicators that flag where returns are at risk weeks before occupancy or revenue reflects it. Pattern recognition across multiple assets that no single property review would ever surface on its own.
The investors who are closest to their portfolio performance right now are not necessarily the ones doing more work. They are the ones working from better signals, earlier. AI is what is making that possible without adding the operational complexity that used to come with that level of visibility.
Related:
How the Investor's Relationship With Portfolio Performance Has Changed
For most of multifamily investing's history, the investor's role during the hold period was defined by the reporting cycle. Monthly financials came in, occupancy numbers got reviewed, and if something looked off, a conversation with the operator followed.
The information was structured, periodic, and retrospective. It told you what had happened. What you did with that information depended on how quickly you could diagnose the cause and how much runway remained to address it.
That model was built for a market with a slower feedback loop. When conditions were stable and forgiving, a 30 or 60 day lag between a performance shift and an investor becoming aware of it was manageable. The asset would still be there. The correction could still be made. The return impact was real but containable.
The feedback loop has compressed.
Markets that were undersupplied two years ago have absorbed significant new inventory. Rent growth that was reliably positive has flattened or reversed in markets that felt safe as recently as 2023. According to CBRE's Q4 2024 Multifamily Market Report, the national multifamily vacancy rate closed 2024 at 4.9% with year-over-year rent growth at just 0.5%, reflecting a market where pricing power remains constrained and operational decision quality has become the primary driver of performance.
The other thing that has changed is the nature of the signals worth monitoring. Occupancy and revenue are outcomes. By the time they move, the decisions that determine where they landed have already been made, or missed.
The signals that actually predict where those outcomes are heading live upstream, in leasing velocity, renewal conversion trends, expiration concentration, and pricing alignment relative to current demand conditions. Those signals are available. Most periodic reporting structures are not built to surface them.
What this has created is a gap between the investors who are monitoring outcomes and the investors who are monitoring the conditions that produce outcomes. The first group finds out what happened. The second group sees what is happening and has time to respond while the response still matters.
Closing that gap used to require either deep operational involvement, which most investors do not want or have capacity for, or a large enough asset management team to be watching every property closely at all times, which most portfolios cannot justify. AI changes the equation by making continuous signal monitoring possible at the portfolio level without requiring either of those things.
What AI Lets Multifamily Investors See, and When
The value of better information is entirely dependent on timing. Knowing that an asset underperformed last quarter is useful context. Knowing three weeks earlier that it was heading toward underperformance is a different kind of useful. One informs a conversation. The other informs a decision while there is still time to change the outcome.
This is the core of what AI changes for multifamily investors. Not just what is visible, but when it becomes visible. And the earlier in the performance cycle a signal surfaces, the more options remain on the table for responding to it.
1. Portfolio-level Visibility
A portfolio of any real size has assets performing at different levels at any given time. Some are on track. Some are drifting. Some are drifting in ways that are not yet visible in the numbers that get reported monthly. The challenge has always been knowing which is which without having to dig into every property individually on a regular basis.
AI-powered portfolio dashboards change this by giving investors a real-time read on asset health across the full portfolio in a single view. With Rentana, Color-coded performance indicators make it immediately clear which assets are on track, which ones are showing early signs of drift, and which ones need attention now. The investor does not have to wait for a report to be built or a call to be scheduled to know where to focus. The picture is already there.
What matters is that the signals driving those indicators are operational, not just financial. An asset can be flagging yellow on predicted occupancy or leasing velocity weeks before it shows up as a revenue variance in a financial report. Catching it at the operational signal stage rather than the financial outcome stage is what creates the response window.
Related:
- AI Adoption in Multifamily: Why it's Accelerating So Fast
- Why Investors Are Turning to AI-Assisted Real Estate Advice
2. Forward-looking Signals that Flag Return Risk Before the Numbers Move
Retrospective reporting tells you where an asset has been. Forward-looking signals tell you where it is going. For investors focused on protecting returns across a hold period, the second category is significantly more valuable.
Rentana surfaces two distinct forward views. The 30 and 60 day occupancy figures reflect known move-ins and move-outs already in the system, a near term picture based on executed activity. Predicted occupancy connects current leasing activity, renewal trends, and future availability to provide forward visibility into where occupancy is heading.Together they give investors a layered forward view, what is already locked in and what is likely to happen if current conditions hold or if changes need to be made.
Exposure forecasting adds a forward layer that a standard expiration schedule cannot provide. Beyond known lease endings, Rentana's availability forecasting incorporates predicted notices, month-to-month behavior, and other sources of unplanned availability to give a more complete picture of what is actually coming to market.
When that forward availability is building toward a concentration that demand conditions may not absorb cleanly, it surfaces in the pricing recommendations. The investor who sees that pressure building early can have a strategy conversation with the operator while options are still open. The investor who sees it in the financials is having a different kind of conversation.
3. AI Generated Insights that Turn Signals into Briefings
Seeing that a property is flagging on the portfolio dashboard is the starting point. Understanding what is driving it, why it matters, and what response is supported by the current data is what makes that flag actionable.
Rentana's AI generated property insights are structured around exactly that sequence. Each insight surfaces what is changing at a specific asset, explains why it matters in the context of that property's current performance, and connects to a supported action. The investor or asset manager reviewing the dashboard does not arrive at a flag and then has to build the picture from scratch. They arrive at a flag and find a briefing already waiting.
That structure changes the quality of the conversation that follows.
An investor who can walk into a call with an operator already knowing that a specific bedroom type is projecting a material occupancy decline in 60 days, that lead volume is running below target for that layout, and that the recommended response involves a pricing adjustment and accelerated renewal outreach, is having a fundamentally different conversation than one who knows only that the property flagged yellow and needs a closer look.
Read Also:
- Agentic AI in Multifamily: Use cases & How it Works
- How AI Improves NOI for Multifamily Investors
Where to Direct Capital Attention when Multiple Assets are Shifting Simultaneously
This is one of the hold period decisions that gets the least attention but has some of the largest return implications. In a portfolio of 10 or 15 assets, there will always be periods where multiple properties are shifting at the same time. Occupancy softening at one. Leasing velocity slowing at another. Renewal pressure building at a third. The question is where to focus first.
Without a connected portfolio view, this call gets made based on whoever is being loudest about their asset's problems, or on the most recent report that happened to cross someone's desk. Neither is a reliable way to prioritize.
AI that surfaces the relative performance and forward trajectory of every asset in the portfolio simultaneously gives investors a principled basis for directing attention. An asset that is drifting on predicted occupancy with a high expiration concentration coming in 45 days deserves attention before an asset that is showing a minor leasing slowdown with a healthy renewal pipeline.
For investors managing capital across multiple assets, the ability to see the full picture and direct attention to where it will have the most impact is one of the clearest ways AI changes hold period performance. Not by doing the work, but by making sure the work gets done in the right place at the right time.
1. Staying Closer to Portfolio Performance Without Adding Operational Complexity
There is a version of close portfolio monitoring that requires a large asset management team, weekly calls with every operator, and hours spent pulling data from multiple systems into a coherent picture. Most investors do not have the infrastructure for that, and many do not want it. The appeal of multifamily as an asset class is partly that it does not require that level of day-to-day involvement to perform well.
The challenge has always been that staying hands-off during the hold period meant accepting a lag between when performance shifted and when you found out about it. The choice felt binary. Either you were deeply involved operationally or you were dependent on periodic reporting that was already stale by the time it reached you.
AI changes that tradeoff.
The visibility that used to require operational depth can now be delivered through a connected intelligence layer that monitors signals continuously and surfaces what matters without requiring an investor to dig for it.
2. Complementing the Review Process with a Forward-looking View
Periodic reporting is not going away and it should not. Quarterly reviews, financial statements, and variance analysis are all essential parts of how investors track strategy performance over time. They tell you how the asset has performed relative to underwriting, where the plan is on track, and where it has diverged.
What they do not tell you is where performance is heading next. That forward view, predicted occupancy over the next 60 and 90 days, renewal conversion trends relative to upcoming expirations, leasing velocity signals at the funnel stage level, is what AI adds to the investor review process. The retrospective reporting tells you how the strategy has performed. The AI layer tells you where it is going.
Together they give investors a complete picture that neither provides on its own. A quarterly review that shows strong occupancy alongside a forward view showing leasing velocity softening and a concentration of expirations building in 60 days is a different conversation than a quarterly review alone. The first version of that conversation has time for a proactive response. The second one is catching up.
3. Drilling Down when Something Needs Attention
One of the practical advantages of a well-built portfolio intelligence layer is the ability to move quickly from a high-level signal to a specific answer without having to pull reports from multiple systems.
An investor who sees a property flagging on predicted occupancy should be able to click into that asset and understand immediately whether the issue is a leasing velocity problem, a renewal conversion problem, a pricing misalignment, or an expiration concentration building in a specific unit type. That drill-down from portfolio level to property level to unit type level is what turns a flag into an actionable conversation with the operator.
Without that capability, the flag triggers a process. Someone has to pull the data, build the picture, and schedule the call. By the time the conversation happens, more time has passed. With it, the investor arrives at the conversation already knowing what they are looking at and what questions to ask.
Related:
How Rentana Helps Multifamily Investors
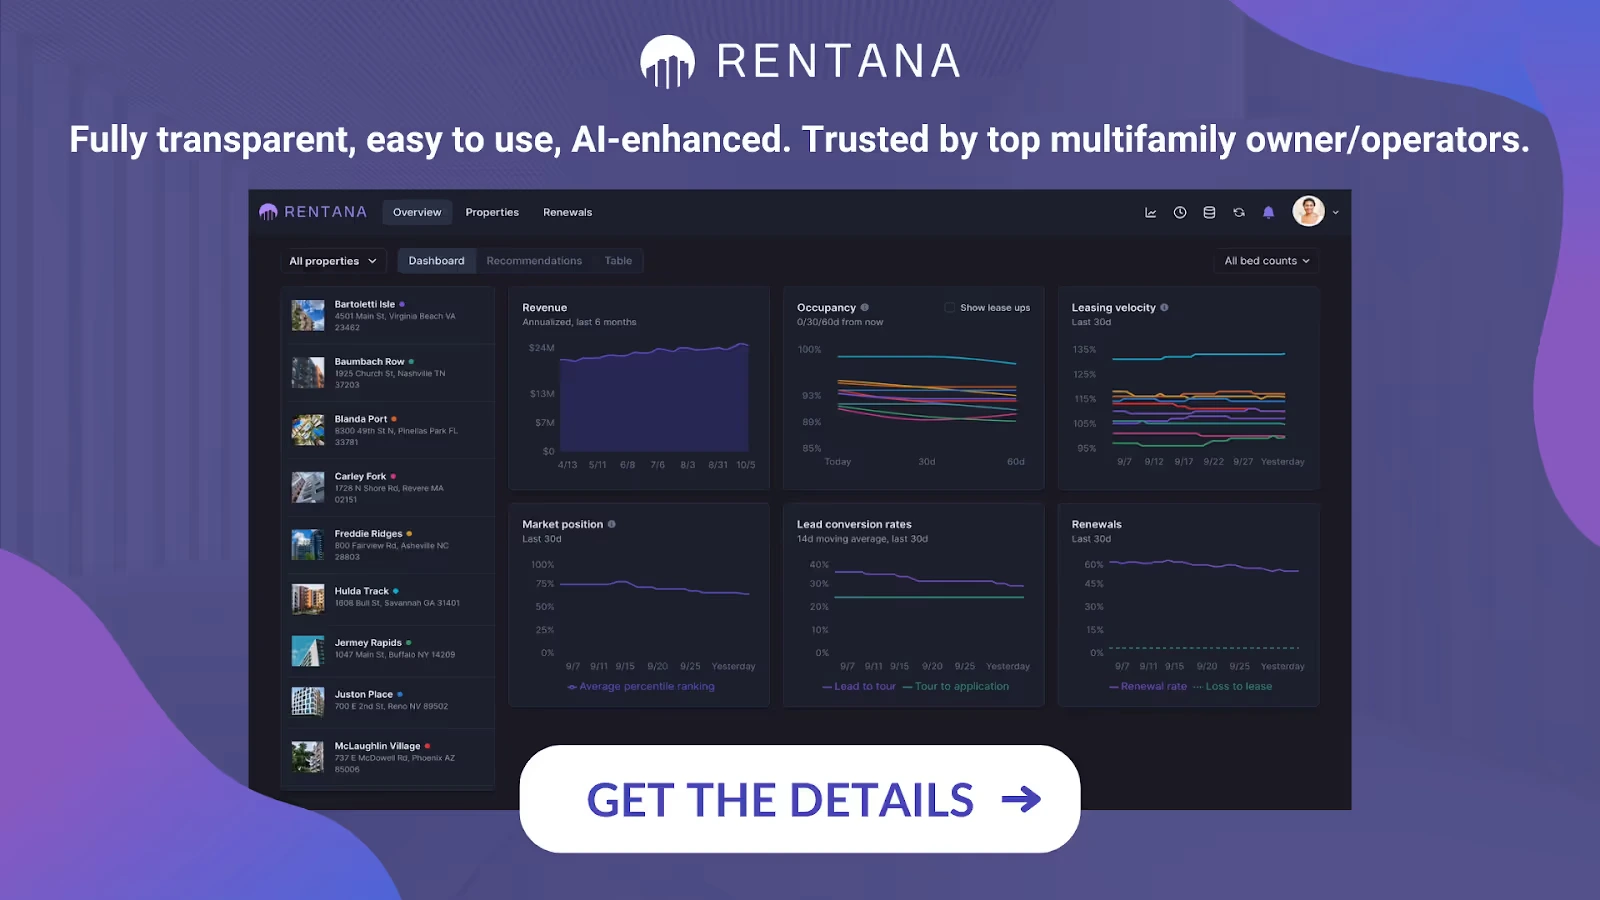
Rentana is built around this model of portfolio visibility without operational complexity. The portfolio dashboard gives investors a color-coded read on asset health across the full portfolio, with performance indicators that surface which assets are on track, which are drifting, and which need attention now, without requiring anyone to build a report first.
AI-generated property insights follow the structure that makes portfolio monitoring actionable at scale. Every insight surfaces what is changing at a specific asset, explains why it matters in the context of that property's current performance, and connects to a supported action. The investor is not handed a data point. They are handed a briefing that is already connected to a response.
What that looks like in practice is illustrated by how 29th Street Capital, a firm managing a portfolio of more than 12,000 units, approached the decision to modernize their revenue intelligence infrastructure. After a two-month review of eight software vendors and a 90-day head-to-head pilot against a competing platform, 29SC selected Rentana.
The results from the pilot were concrete: $4.6 million in incremental property value, 3.5% stronger net rental income growth, and faster decisions across every level of the firm compared to the control group.
"I would recommend Rentana without a doubt," said Robert Waz, VP at 29th Street Capital. "The UI is miles ahead, we trust their data security, and their fast, insightful and personalized platform gives us a strategic advantage to grow our assets."
What drove that outcome was not just the technology. It was the combination of transparent pricing logic, real-time market signals, and a platform that teams across leasing, asset management, and ownership could actually use without a steep learning curve. 29SC credited onboarding that took one to two days rather than the three to six weeks typical of legacy systems, and support response times that averaged five minutes rather than three days.
For investors, the 29SC outcome points to something specific. The performance gap between Rentana-powered properties and the control group did not come from doing more work. It came from making better calls, faster, with clearer information. That is the return case for AI-driven portfolio visibility in plain terms.
For investors who want to stay closer to performance across the hold period without adding the operational infrastructure that used to come with that level of visibility, this is what the shift looks like in practice. Better signals, earlier. A connected picture across every asset. And the ability to move from awareness to action without the lag that periodic reporting has always carried.
Don’t Miss:
- How to Manage Large Multifamily Portfolios
- Multifamily Performance Reporting: Metrics That Drive Performance
Conclusion on How AI Impacts Multifamily Returns
The hold period has always been where multifamily returns are made or lost. What has changed is how much of that outcome is now determined by the quality and timing of decisions made between acquisition and disposition, and how visible those decision points are to the investors responsible for the return.
Periodic reporting was built for a slower market. The investors closing the gap between what their portfolios could be doing and what they are actually doing are the ones who stopped waiting for the numbers to tell them something had already gone wrong.
The question worth asking is simple: by the time your current reporting tells you something needs attention, how much runway do you still have to do something about it?
If the honest answer is not enough, Rentana is worth a closer look.