A property report is where operating data becomes a decision. It tells asset managers, operators, and owners how a property is performing against its goals, where risk is building, and what needs attention next. When the report is built around the right metrics and the right audience, it shortens the path from a performance change to a response.
Disconnected systems remain a significant reporting challenge in multifamily operations. In Disconnected Data Limits AI's Impact in Multifamily, industry expert Donald Davidoff explains how fragmented pricing, leasing, budgeting, and maintenance data can force analysts to spend substantial time consolidating information rather than interpreting it. A well-designed property report helps address this challenge by defining what gets reviewed, how information is organized, and who is responsible for acting on it.
This article walks through how to set up a real estate property report, which metrics to include, and how scheduled reporting and AI-generated insights keep the process consistent.
Related:
What Is a Real Estate Property Report?
A real estate property report is a structured summary of a property’s financial, leasing, occupancy, and operational performance over a defined period. It gives asset managers and property operators a consistent view of how the asset is tracking against its goals, which conditions are changing, and which risks deserve closer review.
The most useful reports go beyond describing results. They show what changed, why it may matter, and where management should focus, so the report supports a decision instead of documenting an outcome.
How to Set Up a Real Estate Property Report in 8 Steps
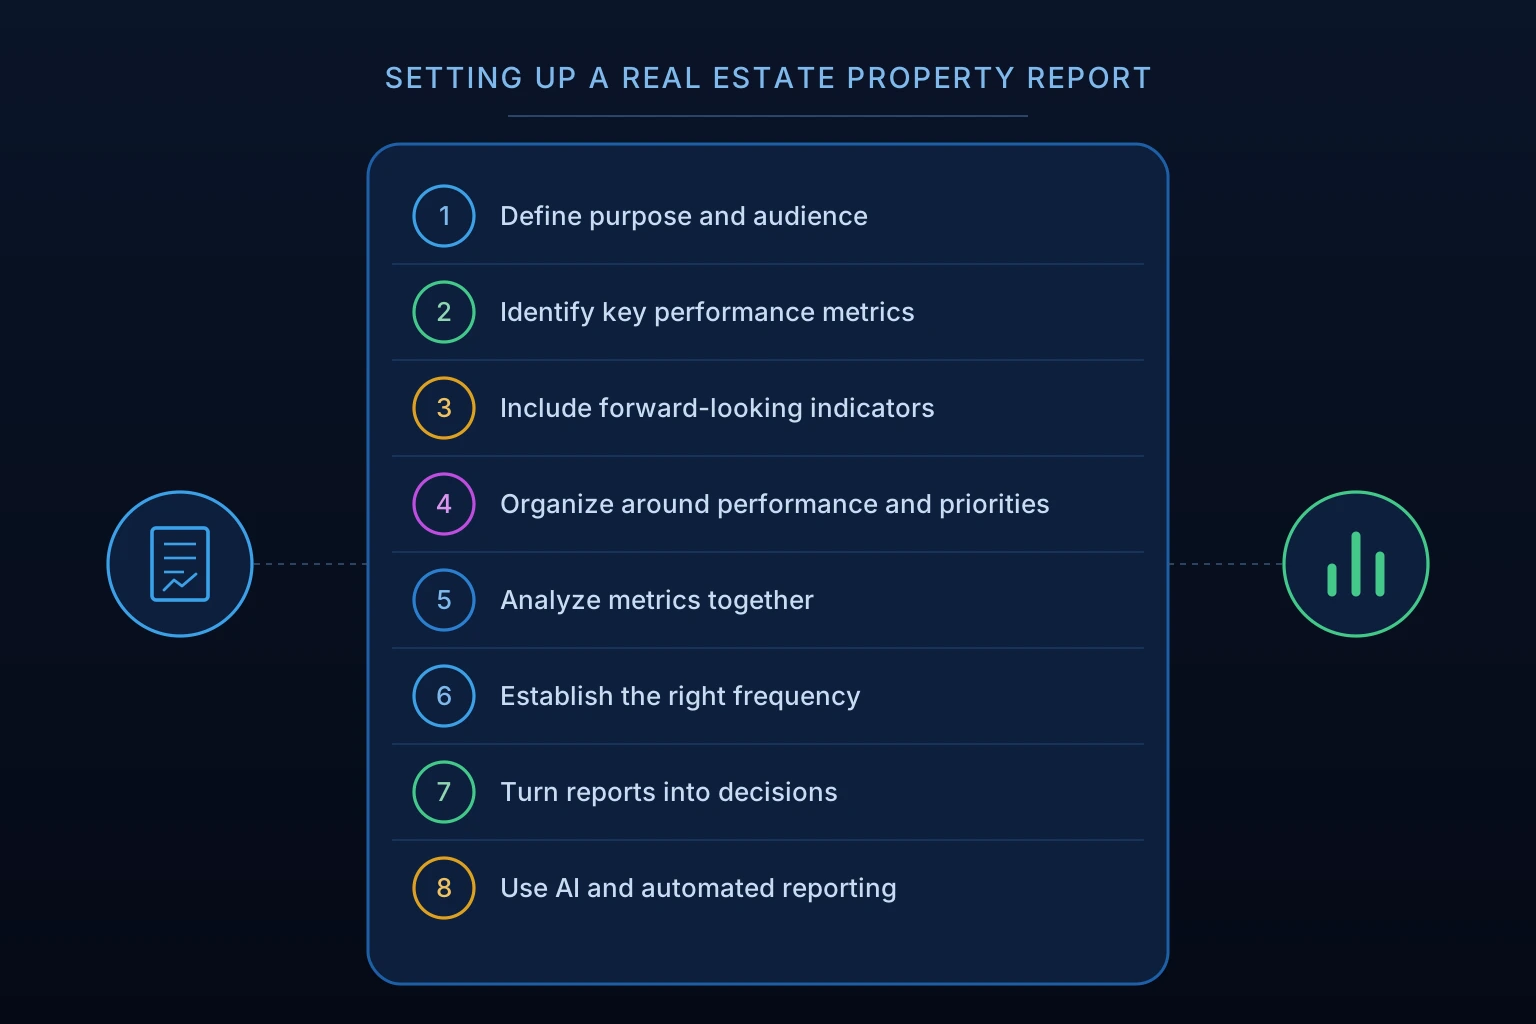
- Define the Purpose and Audience
- Identify the Key Property Performance Metrics
- Include Forward-Looking Performance Indicators
- Organize the Report Around Performance and Priorities
- Analyze Metrics Together to Understand Performance
- Establish the Right Reporting Frequency
- Turn Property Reports Into Actionable Decisions
- Use AI and Automated Reporting to Improve Analysis
1. Start by Defining the Purpose and Audience
Reporting needs vary by role, and the metrics should follow the decisions each audience makes.
- Onsite teams need daily and weekly visibility into availability, leasing activity, and follow-ups
- Regional managers need to see which properties are drifting from plan and where support is needed
- Asset managers need performance against targets, forward exposure, and revenue trends by property and portfolio
- Ownership groups need a concise view of occupancy, NOI direction, and progress against the business plan
According to Multi-Housing News, the nation’s leading property managers oversee more than 4.1 million units across approximately 18,800 communities. At that scale, a single report cannot serve every reader. Decide which decisions the report should support before selecting a single metric.
Read Also:
2. Identify the Key Property Performance Metrics
Group metrics into five categories and evaluate them at the layout level wherever possible, since property averages hide the differences that matter most.
Occupancy
- Physical occupancy, economic occupancy, and target occupancy
- Vacancy trends over rolling periods
Leasing
- Leasing velocity by layout against forward availability
- Lead-to-lease conversion by funnel stage
- Achieved rents and concession usage
Renewals
- Renewal conversion by layout and expiration window
- Renewal offers and trade-out
- Upcoming expirations and outreach coverage
Revenue
- Rent roll performance and lease trade-outs
- Loss to lease by layout
- Performance against budget
Financial
- Collections
- Operating expenses
- NOI
3. Include Forward-Looking Performance Indicators
Historical metrics describe results that are already set. A property report also needs indicators that show where performance is heading while there is still time to respond.
The forward-looking indicators worth including:
- Upcoming lease expirations by layout and month with seasonal demand
- Confirmed notices to vacate that are not yet reflected in vacancy
- Expected renewals based on historical retention trends and upcoming expirations
- Predicted availability, which considers known upcoming availability and anticipated turnover to provide a more complete picture of future exposure
- Projected occupancy compared against the property's occupancy target
A property sitting at its occupancy target today can carry a concentrated expiration window 45 days out. Without these indicators, that exposure stays invisible until it reaches the occupancy number.
4. Organize the Report Around Performance and Priorities
A practical structure keeps readers focused on what matters:
- Executive summary: The three to five changes that most affect performance this period
- Current performance against targets: Occupancy, achieved rents, and key goals
- Leasing and revenue trends: Velocity, conversion, concessions, trade-out, and loss to lease
- Forward-looking exposure: Expirations, notices, predicted availability, and projected occupancy
- Financial performance: Collections, expenses, and NOI
- Recommended actions: What to evaluate or adjust, and who owns it
Highlight meaningful changes and exceptions. A report that presents every metric with equal weight leaves prioritization to the reader. Consider using a standardized reporting template with columns for the metric, current result, target, change from the previous period, and recommended action. This makes performance easier to evaluate consistently across properties and reporting periods.
5. Analyze Metrics Together to Understand Performance
Metrics carry more meaning in combination than in isolation. Two common patterns show why.
A property can meet its occupancy target while achieved rents decline. This warrants a closer look at leasing velocity, concessions, unit mix, pricing adjustments, and future exposure.
For example, a greater proportion of leases signed on lower-priced floorplans could pull down average achieved rents without indicating weaker pricing performance across the entire property. Understanding the underlying cause helps determine whether a pricing or leasing strategy adjustment is necessary.
Leasing velocity can look strong while upcoming expirations concentrate in the same layout. The pace is healthy today, and the forward picture shows availability that current velocity may not absorb.
Reviewing metrics as connected signals helps identify the underlying driver, which determines whether the right response involves pricing, marketing, renewals, or lease terms.
Top Picks:
6. Establish the Right Reporting Frequency
Different decisions run on different clocks.
- Daily: Available units and leasing activity, supporting immediate leasing and pricing decisions
- Weekly: Leasing velocity, funnel conversion, renewal outreach, pricing changes, and forward exposure, which surface emerging risks
- Monthly: Executed leases, trade-out, loss to lease, performance against targets, and financial results
- Quarterly: Asset strategy, portfolio comparison, and ownership reporting
According to the National Apartment Association's analysis of 2024 operating benchmarks, repairs and maintenance expenses increased nearly 28% between 2021 and 2024, compared with just 10% growth in NOI for the same-store properties analyzed. With operating expenses outpacing income growth, timely reporting helps operators identify emerging performance issues and evaluate opportunities to protect profitability.
7. Turn Property Reports Into Actionable Decisions
A report creates value when it leads to action. A simple process keeps that connection consistent:
- Identify the change. What moved since the last report?
- Investigate contributing factors. Check related signals such as conversion, availability, and renewals.
- Decide whether action is needed. Some changes warrant monitoring, others warrant a response.
- Assign responsibility. Name the owner and the timeline.
- Monitor results. Confirm in the next report whether the change had the intended effect.
For example, if a floorplan shows slowing leasing velocity and weaker tour-to-application conversion, the team should investigate pricing, unit desirability, prospect feedback, and leasing follow-up before determining the appropriate response. If lease expirations are concentrated in a future month, the team can prioritize renewal outreach to minimize near-term exposure while evaluating lease-term strategies to prevent similar concentrations in future leasing cycles.
8. Use AI and Automated Reporting to Improve Property Analysis
Scheduled reporting removes the manual preparation step. The same reports reach the same audiences on the same cadence, whoever is available to build them that week. That consistency makes trends easier to see and comparisons across properties more reliable.
AI-generated insights add the analytical layer. They summarize what changed, explain why it may matter given current conditions, and point toward where management should focus. The team still owns the judgment, the strategy, and the decision. AI shortens the path to the question worth asking.
How Rentana Supports Multifamily Property Reporting
Rentana connects PMS-sourced operational data into reporting and analytics that cover the metrics and cadence described above.
- Lease Up Mode supports lease-up properties with data-backed planning, goal tracking, forecasting, AI insights, and pricing recommendations aligned to the property’s timeline
- Portfolio dashboards provide consolidated visibility across properties, helping asset managers prioritize which assets warrant closer review
- AI-generated Insights explain what changed, why it may matter, and where to focus
- Scheduled reports automate the delivery of property performance data covering leasing activity, availability, pricing, renewals, compliance, and performance against asset goals. Teams can customize reporting frequency, recipients, and delivery preferences to ensure stakeholders receive consistent, timely information without manual report preparation.
- Predicted Occupancy connects current leasing activity, renewal trends, and future availability into a forward view of where occupancy is heading at each asset
- Target Tracking evaluates actual performance against configured occupancy, pricing, and renewal conversion targets
- Ask Rentana allows users to investigate property and portfolio performance questions through conversational AI, with supporting explanations, charts, and data analysis
- Leasing and renewal metrics show velocity, funnel conversion, renewal conversion, and trade-out by layout
- Property performance dashboards provide visualizations of occupancy, leasing, pricing, renewals, and exposure, with color-coded performance indicators that help teams quickly identify areas requiring attention
- Exposure management surfaces expiration concentration by layout and time window, incorporating confirmed notices, month-to-month behavior, and early terminations
Read Also:
- Top 9 AI Applications in Real Estate
- Will AI Replace Real Estate Agents? Or Transform Them?
Conclusion on Real Estate Property Report
A strong property report starts with a clear purpose and audience, covers occupancy, leasing, renewals, revenue, and financial metrics, and adds forward-looking indicators that show where performance is heading. Organized around priorities and reviewed on a consistent cadence, it gives teams the context to act while options are still open.
Use Rentana to streamline multifamily property reporting with scheduled reports, forward-looking occupancy visibility, target tracking, and AI-generated insights that help turn property performance data into informed decisions.